WLD/USD Analysis: Key Support, Resistance & Trend Insights
In-depth WLD/USD Technical Analysis: Key Support & Resistance Zones, Trend Insights, Elliott Wave Patterns, and Fibonacci Projections for Strategic Trading.

Welcome to TradingWizard's in-depth analysis of the WLD/USD pair. In this article, we will explore key support and resistance levels, trend insights, Elliott Wave patterns, and Fibonacci projections to help traders gain valuable insights and make informed trading decisions. Kai, your personal TradingView assistant, powered by OpenAI's GPT-4, will guide you through this analysis.
Trend Analysis
Timeframe: Daily
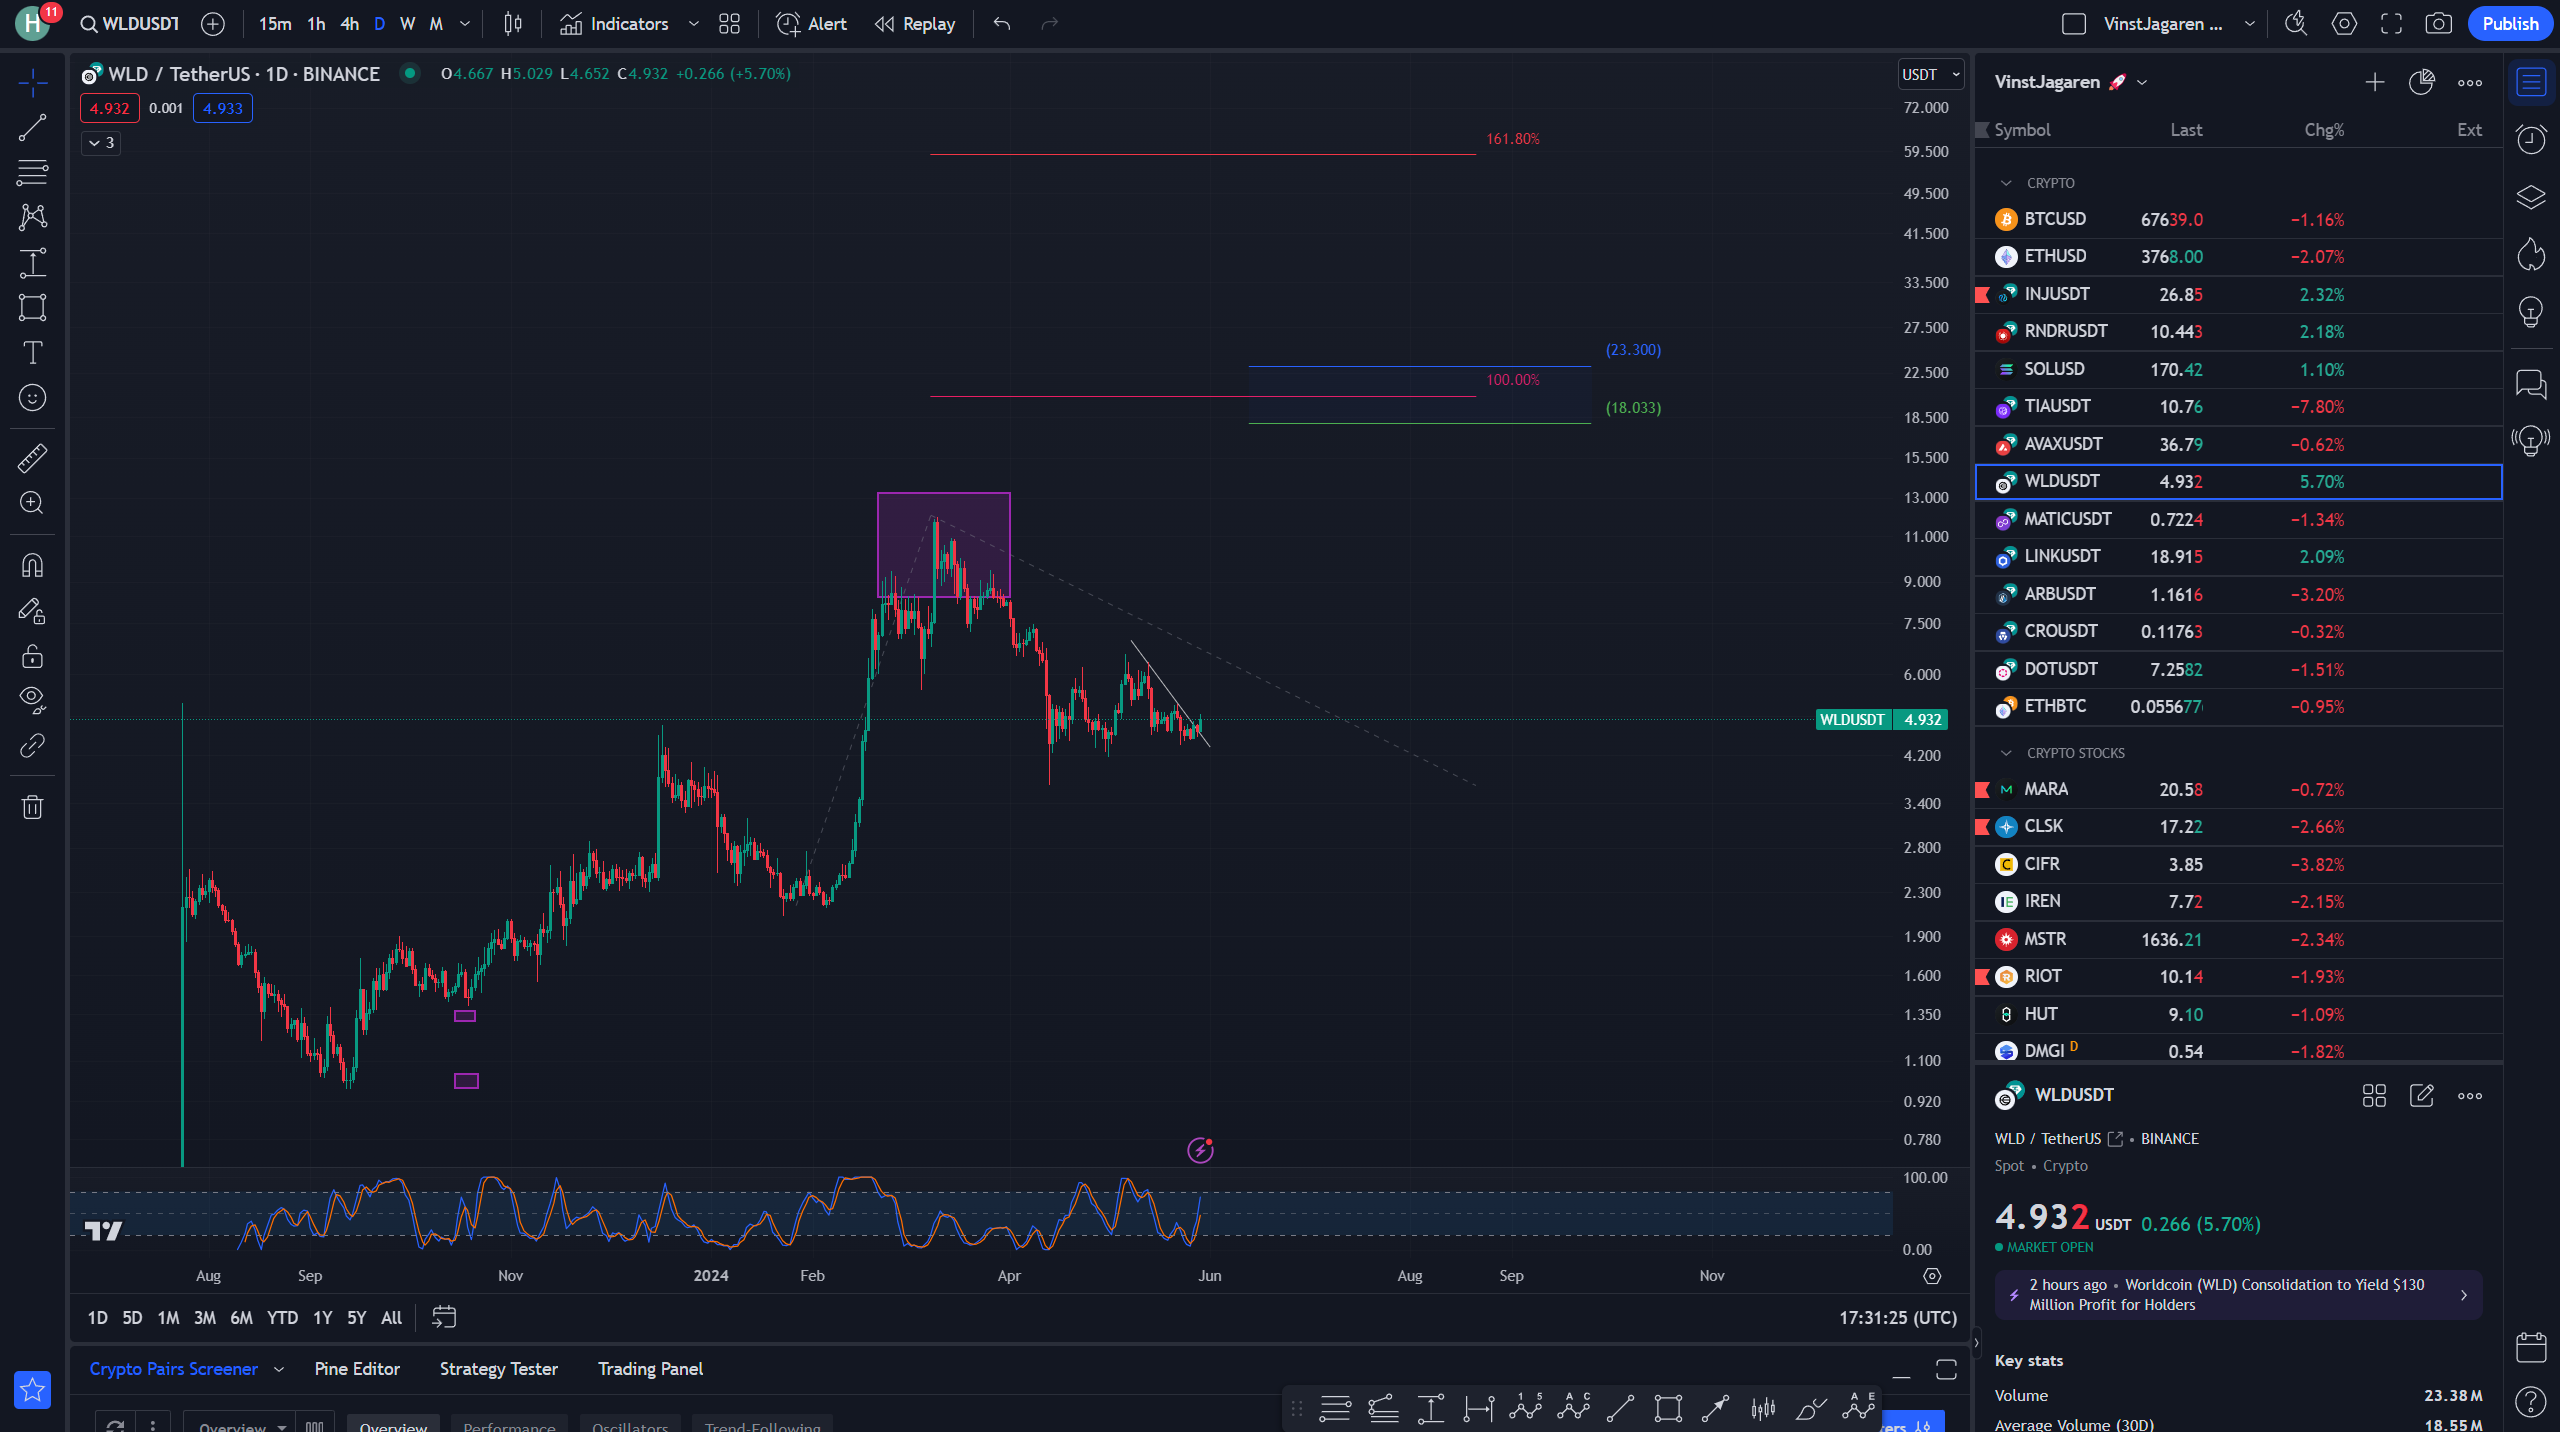
The current trend on the daily chart is bearish. Since the highs in April 2024, the price has experienced a significant downward movement, indicating that the bulls are not yet in full control.
Support and Resistance Levels
- Support Levels: Around $4.20 and $3.80. These levels have provided previous support and are critical to watch if prices decline further.
- Resistance Levels: Around $6.00; this level was tested multiple times during the previous price action and could pose a substantial challenge for buyers.
Price Movement
After peaking in April 2024, the price exhibited a descending structure with lower highs and lower lows, demonstrating ongoing bearish momentum. The latest candlestick shows some bullish activity, which might indicate a potential shorter-term rebound.
Elliott Wave Theory
Analyzing the Elliott Wave patterns:
- Wave 1: $4.30 to $14.00 (a sharp upward trend)
- Wave 2: $14.00 to $6.50 (corrective wave down)
- Wave 3: $6.50 to $18.00 (rapid price increase)
- Wave 4: $18.00 to $10.50 (corrective wave down)
- Wave 5: $10.50 to $20.00 (final upward leg)
The subsequent correction appears to align with the 'abc' corrective pattern:
- a: $20.00 to $12.00
- b: $12.00 to $15.00
- c: $15.00 to current prices around $5.00
Cycle Analysis
- Weekly Cycles: Highs are noted in April 2024, setting up successive lower highs in recent weeks.
- Monthly Highs/Lows: The recent cycle shows monthly lows around the $4.20 mark and highs around $18.00 (April). Based on averages, we may anticipate another low in June if the bearish sentiment persists.
- Upcoming Cycle: The next significant high might target the $8.00-$10.00 range based on previous price action continuity.
Algo Zones Based on Fibonacci
Applying Fibonacci retracement:
- 61.8% retracement level: $8.00 approximate, which closely aligns with a significant resistance.
- 100% extension: Around $18.00, echoing previous highs.
- 161.8% extension: Approximately $23.00, projecting a future bullish target if substantial support levels hold.
Target Projections
- Short Term: $3.80-$4.20 — cautious about a potential drop to support levels.
- Medium Term: $5.50-$6.50 — if the current support holds and a minor uptrend develops.
- Long Term: $8.50-$10.50 — viewing significant Fibonacci retracement levels and resistance from previous highs.
Conclusion
WLD/USD currently shows a bearish overall daily trend but might have some short-term potential for a rebound based on support being held. Future price movements should closely monitor critical support around $4.20 and resistance about $6.00. Utilizing a combination of Elliott Wave, Fibonacci retracement levels, and price cycles offers multiple targets aligning with the outlined trend potentials in different timeframes.
For those new to technical analysis, consider reading our comprehensive guide on what is technical analysis to better understand the concepts and tools used in this analysis. Additionally, explore other insightful articles such as what is day trading and what is Ethereum to expand your trading knowledge.
Don't forget to leverage the power of Kai, your personal TradingView assistant, who can analyze your TradingView chart and provide AI-based technical analysis. Kai can help you with trend analysis, support and resistance levels, price movement, Elliott Wave Theory, cycle analysis, algo zones, and target projections. To get started, download Kai from the Chrome Web Store and take your trading to the next level.
Whether you are an amateur or a medium trader, TradingWizard is here to help you become a better trader, gain valuable insights from your TradingView chart, and speed up your trading analysis. It's free to download and use, and we prioritize user privacy.
🚀 How to use Kai?
- ✨ Click the "Add to Chrome" button and pin it to your toolbar.
- ✨ Log into your account.
- ✨ Go to TradingView, and load your chart.
- ✨ Ask Kai and receive an in-depth analysis.
⚡ We believe you've never seen a trading tool like this. Start your journey with Kai and elevate your trading experience today!