Why ORB Works (Still)
The open concentrates liquidity, news and emotions into minutes. Auction‑market theory and market microstructure both suggest that the first prints help establish the day’s value area and directional intent. When price escapes the early balance with range expansion, continuation is statistically more likely—especially with trend alignment and a strong tape.
- High participation = cleaner momentum & tighter spreads
- Clear invalidation: inside the box (low risk per trade)
- Repeatable: same rules across stocks, futures and crypto
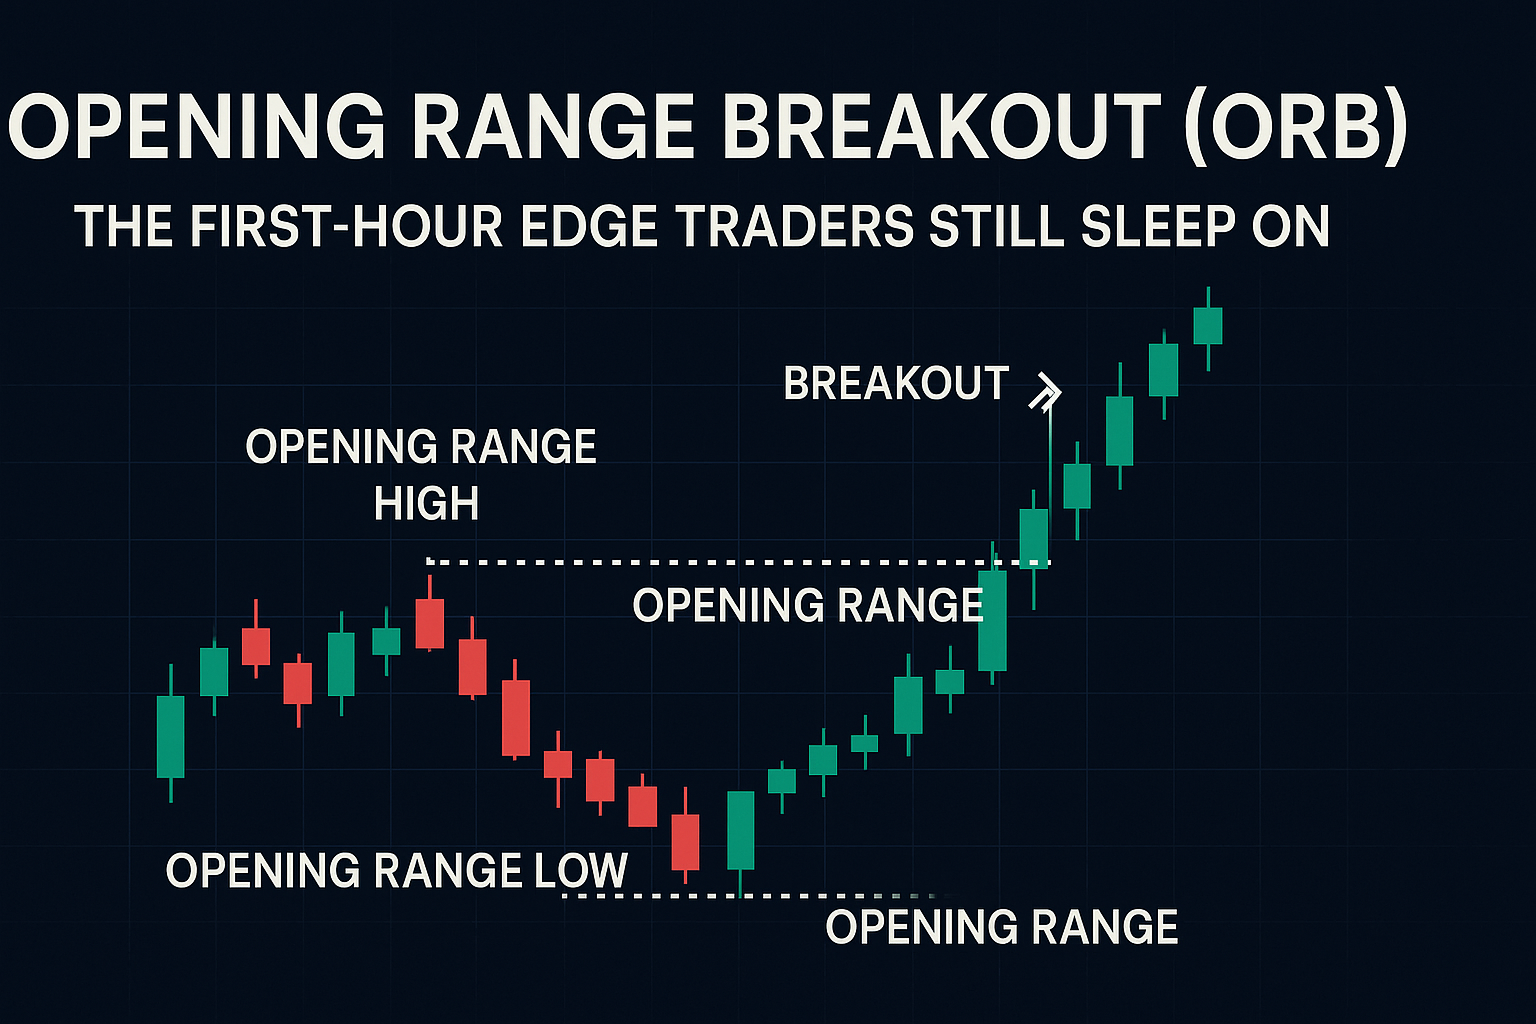
ORB Basics: Define, Timeframes & Assets
The opening range is the high and low of a fixed window after market open—often 5, 15 or 30 minutes. A breakout occurs when price closes beyond that range with momentum confirmation.
- Timeframes: 5‑minute ORB for fast movers; 15‑minute to reduce noise; 30‑minute for swing‑leaning names.
- Markets: US equities (9:30–10:00 ET), index futures (nearly 24/5), and 24/7 crypto (define a daily session, e.g., 00:00–00:15 UTC).
- Sessions: Consider pre‑market/overnight ranges for context (gaps, imbalance).
Useful primers: Investopedia: Opening Range | StockCharts ChartSchool: ORB
The ORB Playbook (Step-by-Step)
- Mark the box: Plot the opening range high and low for your chosen window.
- Wait for confirmation: Break and close outside the range, preferably with rising volume or tape speed.
- Enter: Use a market order or stop‑limit on the close beyond the level, or on the first small pullback.
- Stop: Just inside the box, invalidating the breakout thesis.
- Targets: 1R / 2R scale‑outs; measured move approximately the height of the box; trail remainder using structure or VWAP.
- If it re‑enters: Exit. Failed breakouts become range trades—don’t argue with the box.
Quick Reference (Keep at Your Desk)
| Item | Rule of Thumb |
|---|---|
| Window | 5–15 minutes for day trading; 30 minutes for slower names |
| Stop | Inside the box (less than or equal to box width) |
| Targets | 1R, 2R, measured move (box height) |
| Filter | Trend (EMA/VWAP), ATR %, catalyst present |
| Skip | Thin names, wide spreads, overlapping higher‑timeframe supply |
Pro Filters: Trend, Volatility & Catalysts
- Trend alignment: Only take upside ORB if price is above VWAP or EMA(20); downside if below. Learn about VWAP from Investopedia.
- ATR guardrails: Require a minimum daily ATR % (e.g., greater than 2% for large caps) so the measured move is worth it. See Investopedia: ATR for more.
- Catalyst context: Earnings, guidance, macro prints and product news. Strong catalysts improve follow‑through.
- Liquidity: Use minimum average volume and tight spreads. Avoid illiquid tickers and tiny floats unless experienced.
Five ORB Setups That Travel Well
1) 15‑Minute Clean Break
Wait for the first 15‑minute candle to close. Enter on a break and close of the box with increased volume. Simple and robust.
2) VWAP‑Aligned ORB
Take only the direction that’s already above or below VWAP. Filter out half‑bakes that snap back into the range.
3) Gap‑and‑Go ORB
For gap‑ups with news: if the gap holds above pre‑market high and the ORB breaks up, momentum continuation is common.
4) ORB → First Pullback
Skip the initial breakout; buy the first higher‑low (or short the lower‑high) that respects the ORB level as new support or resistance.
5) Inside‑Day ORB
When the prior day was an inside bar, a decisive ORB and daily range break can travel further than usual.
Risk, Sizing & Common Traps
- Risk per trade: Keep losses small (many pros cap 0.5%–2% per trade). Learn risk management basics from Investopedia.
- Avoid overtrading: One to three high‑quality ORBs beat 10 low‑quality attempts.
- Spread/slippage: The open can be slippery—use stop‑limits if fills are poor.
- News whipsaws: If a key macro print hits inside your window, widen the box or step aside.
- Re‑entries: Don’t revenge‑trade failed ORBs. Wait for a fresh pattern (first pullback, higher‑timeframe break).
Automation with TradingWizard.ai
Turn ORB from “gut feel” into a repeatable system:
- Market Scan: Screen for tickers with strong catalysts, ATR % and liquidity before the open. Try Market Scan
- Chart Analyzer: Drop a screenshot; get range marking, trend context and target math. Open Chart Analyzer
- Algo AI Bots: Auto‑draw the opening box per symbol, alert on confirmed breaks, and enforce stops and partials. Explore Bots
FAQ
What’s the best opening window: 5, 15 or 30 minutes?
There’s no universal best. Five minutes captures more moves but also more noise. Fifteen minutes balances noise versus follow‑through. Thirty minutes suits slower names or swing bias. Backtest by asset and session.
Where should I place the stop?
Inside the box on the opposite side of the breakout (e.g., long: below the opening range low). If price re‑enters and closes inside, the thesis is invalid.
Does ORB work in crypto?
Yes—define a consistent session open (e.g., 00:00 UTC) and measure the first X minutes. Combine with BTC dominance, funding and VWAP filters for trend confirmation.
How many trades per day?
Often one to three is plenty. Overtrading kills the edge. Let the scanner or bot do the waiting; you do the executing.