NVIDIA (NVDA) Chart Analysis: Bullish Opportunities Amid Volatility
NVDA Chart Overview: Bullish Trend Remains Intact

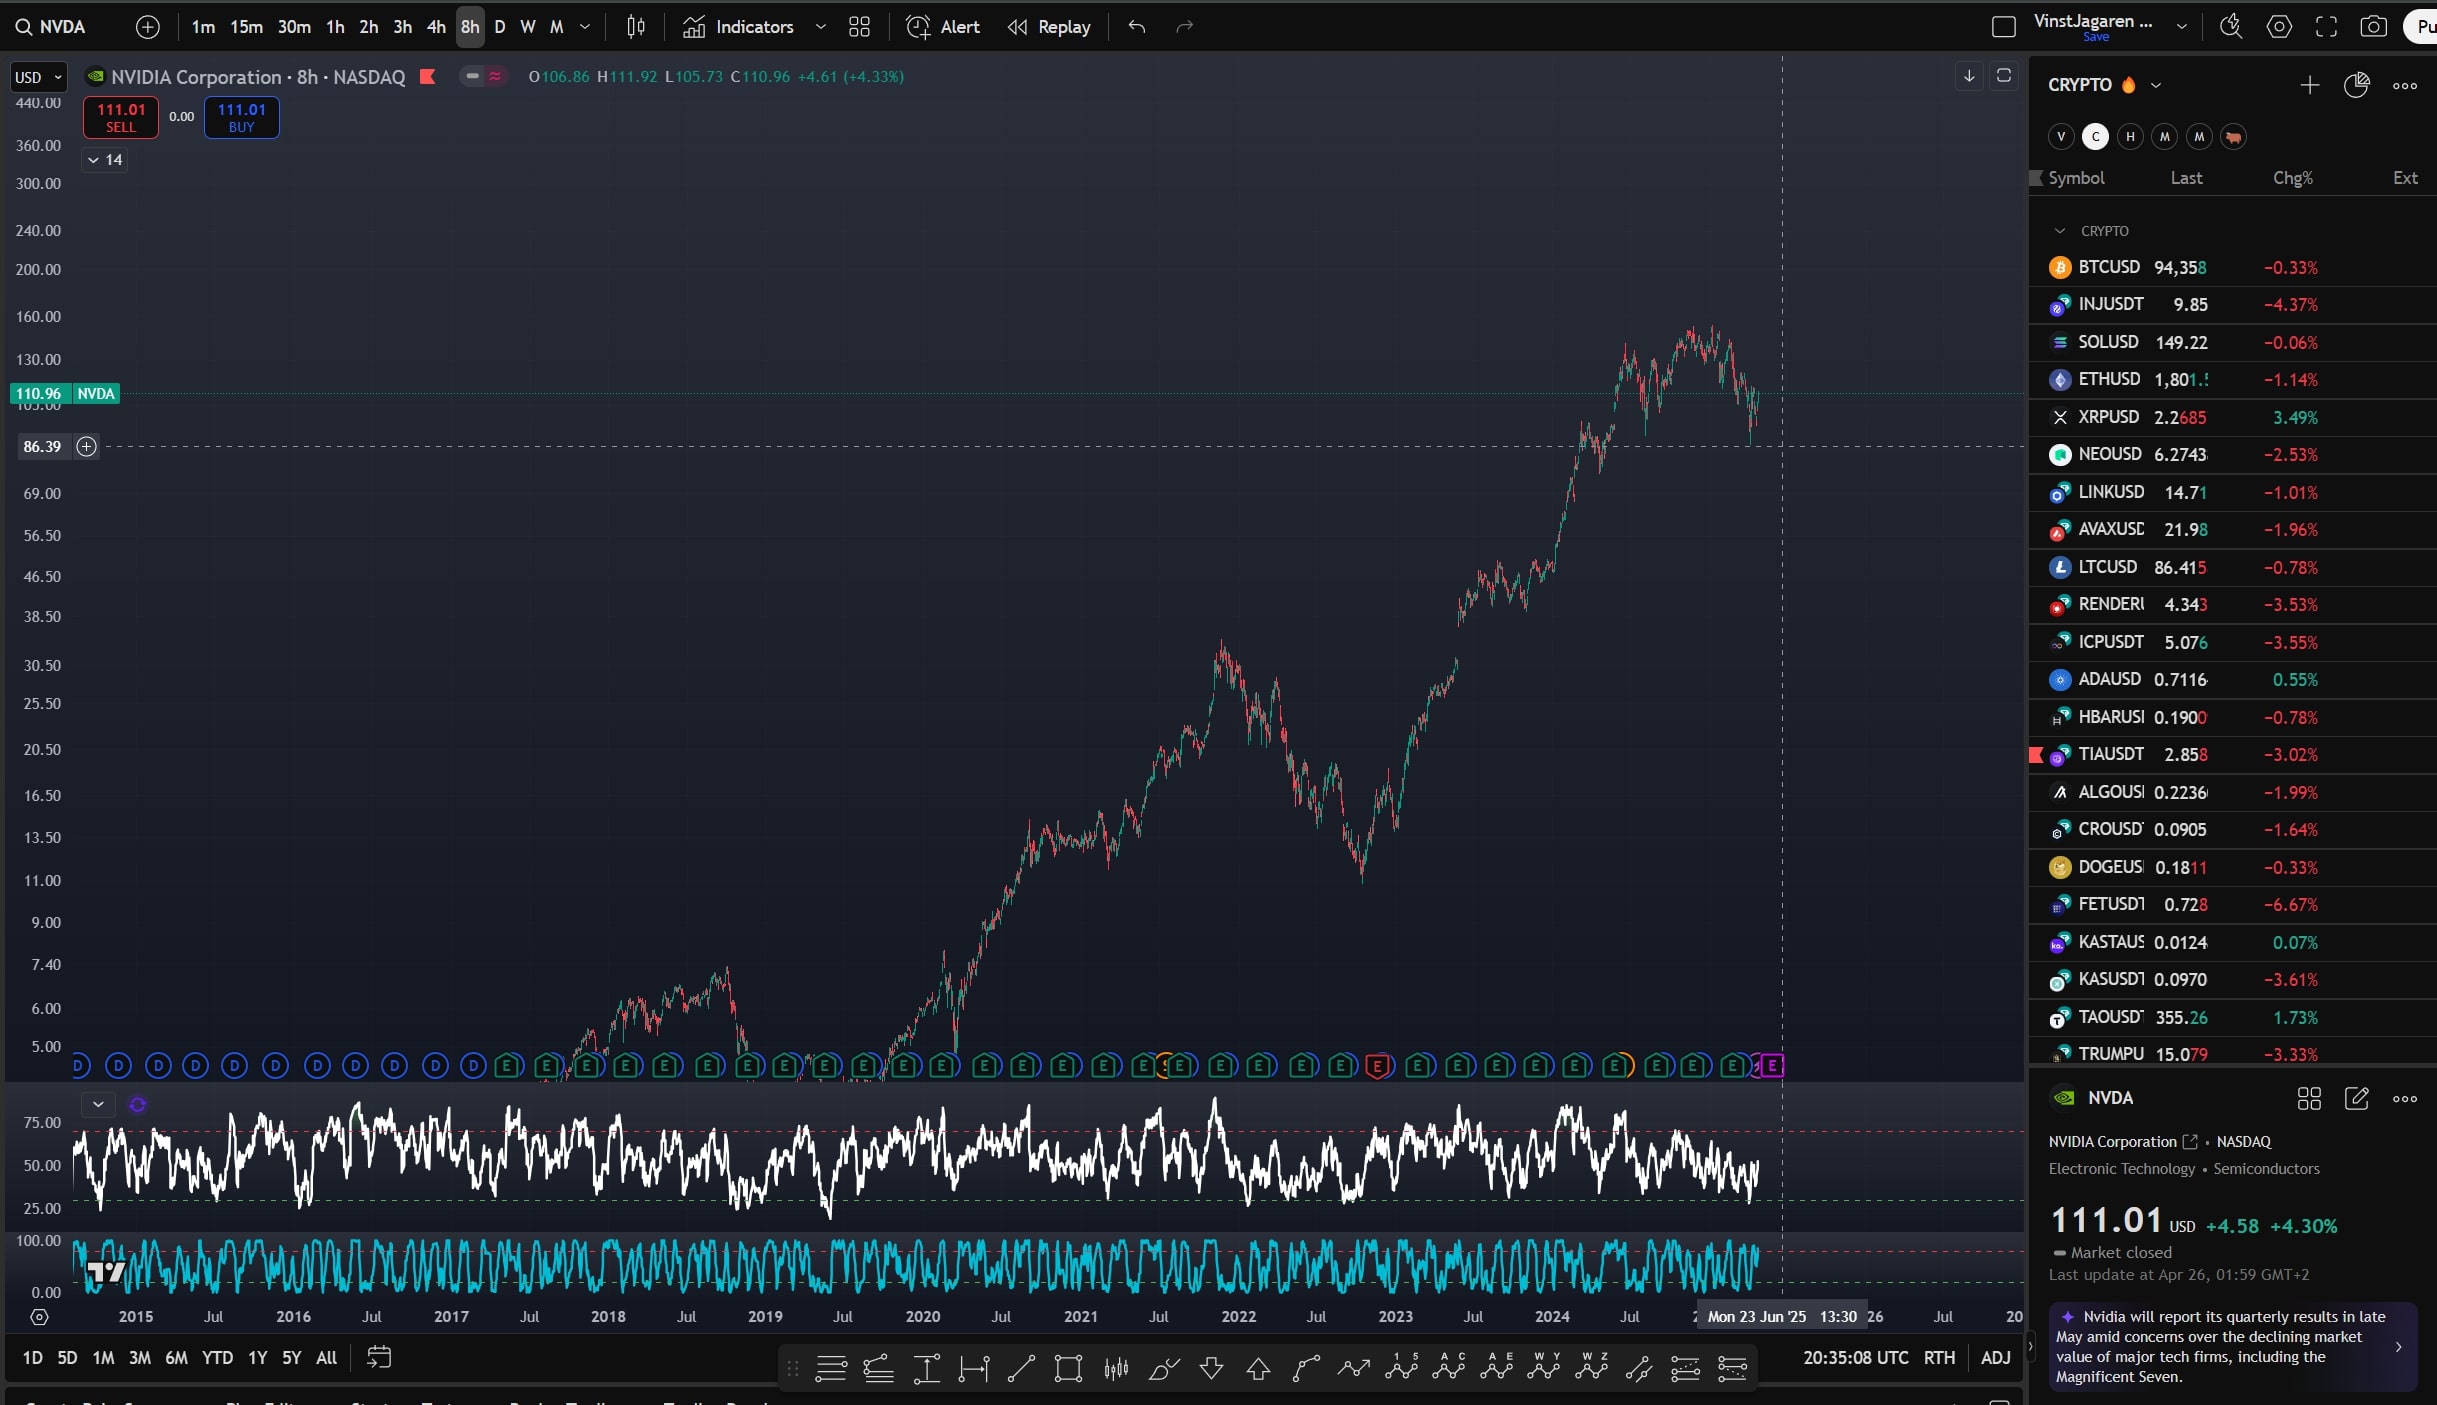
NVIDIA Corporation (NVDA) continues to be a centerpiece of trader attention, consistently delivering high volatility and strong market sentiment. The latest 8-hour chart analysis signals a robust bullish trend, making NVDA an attractive candidate for both swing and position traders. In this article, we break down NVDA’s current technical landscape, optimal trade setups, and how to leverage cutting-edge tools like TradingWizard.ai’s Kai AI companion for superior trading insights.
Understanding the NVDA Bullish Setup
NVDA’s chart presents a textbook long-term uptrend, underpinned by a sequence of higher highs and higher lows since 2020. After a strong upward impulse, the price is currently consolidating, offering a potential entry point for swing traders. Here’s an actionable roadmap based on current data:
- Trend: Bullish
- Volume: 8/10 – significant activity confirms interest
- Volatility: High – rapid price movements create opportunities and risks
- Market Sentiment: 8/10 – strong bullish consensus
- Confidence Score: 9/10 – high conviction in trend continuation
Trade Setup & Risk Management
| Entry Price | Stop Loss | Take Profit | Risk/Reward | Timeframe |
|---|---|---|---|---|
| 111.01 | 105.73 | 130.00 | 1:2 | 8H |
The key to capitalizing on NVDA’s bullishness is timing your entry with confirmation. Monitor price action for stabilization above local support, watch for a bullish reversal on increased volume, and protect your trade with a stop loss below the corrective swing low.
Technical Breakdown of NVDA
1. Overall Trend Context
The chart shows a persistent long-term uptrend, with brief corrective cycles but dominant bullish price structure since 2020. The most recent correction appears contained compared to the magnitude of the move, suggesting ongoing bullish momentum.
NVDA’s multi-year rally has been punctuated by sharp, but relatively shallow, corrective moves. This pattern speaks to strong institutional buying and confidence in NVIDIA’s growth prospects, especially in AI and semiconductor sectors. For traders, these contained corrections are often ideal re-entry opportunities.
2. Wave Structure & Patterns
The price action displays an impulsive wave structure to the upside, with a five-wave advance evident from the Covid lows. A corrective phase is underway, potentially forming an ABC pullback, but no clear reversal is signaled yet.
The Elliott Wave structure suggests NVDA may be in the midst of a classic ABC correction after a five-wave rally. Traders should look for signs of wave C completion—this often signals the end of the pullback and the start of a new impulse leg. Combining wave analysis with day trading or swing trading strategies can maximize returns.
3. Momentum & Volatility Analysis
Volatility is elevated, typical for NVDA, particularly around earnings. RSI and other oscillators show a recent retreat from overbought, but momentum remains positive, indicating the potential for another bullish leg after consolidation.
Momentum indicators like RSI confirm that NVDA has cooled from overbought conditions but remains in a positive momentum regime. Elevated volatility—while intimidating for some—actually enhances the risk/reward for well-managed trades, particularly when using AI-powered analysis to filter noise.
How to Trade NVDA with Kai from TradingWizard.ai
Harnessing the power of AI in today’s fast-paced markets is no longer optional—it’s essential. Kai, your personal TradingView AI companion, is engineered to deliver actionable chart insights, streamline your workflow, and keep you ahead of the curve.
- Install Kai: Add Kai to Chrome or download for your device.
- Pin and Log In: Place Kai on your toolbar for instant access and connect your TradingWizard account.
- Analyze Instantly: Open your NVDA chart in TradingView, ask Kai for a detailed analysis, and receive in-depth, data-driven feedback in seconds.
Kai not only accelerates your analysis but also keeps your data private and secure, ensuring you stay in control of your trading journey.
Action Plan for Swing Traders
- Wait for a bullish momentum signal above the current support zone (~111.01).
- Enter with a stop loss at 105.73 to cap downside risk.
- Set a take profit at 130.00, targeting a return to prior highs.
- Monitor volume—confirmation on increased buying strengthens the setup.
If you’re new to technical trading, visit our Trading Academy for comprehensive guides and strategies on chart reading, risk management, and advanced trading techniques.
Comparing NVDA to Other Trading Opportunities
While NVDA is currently in the spotlight, diversifying your trading portfolio is key. Explore our analysis of Bitcoin vs Ethereum for insights into crypto opportunities, or read about fiat vs crypto currency to understand fundamental market differences.
Frequently Asked Questions About Trading NVDA
- How do I use Kai for technical analysis?
- What does a TradingWizard.ai subscription include?
- What is the recommended position size for high-volatility stocks?
For more answers, check our detailed FAQ section.
Summary: NVDA’s Bullish Path Forward
NVIDIA (NVDA) continues to reward traders who recognize its dominant trend and manage risk effectively. The current setup—characterized by high volume, bullish sentiment, and a contained correction—suggests further upside is likely, provided support holds. By pairing disciplined trade management with the advanced features of Kai from TradingWizard.ai, you can maximize opportunity and stay one step ahead in volatile markets.
- Monitor chart structure for confirmation of reversal
- Use AI-powered analysis for faster, more accurate decisions
- Apply sound risk/reward principles (target 1:2 or better)
- Stay educated through our Trading Academy
Ready to elevate your trading? Try TradingWizard.ai today and experience the future of chart analysis with Kai.