The Catalyst
The equity markets reached a structural inflection point on February 12, 2026. Supply chain intelligence from Taiwan Semiconductor (TSMC) indicated that NVIDIA’s Blackwell architecture has reached high-volume manufacturing efficiency earlier than forecasted. This data triggered a massive institutional re-weighting into the semiconductor sector, coinciding with the Dow Jones Industrial Average breaching the 50,000 mark.
- Event: Blackwell B200 production yield confirmation and HBM4 integration roadmap.
- Reaction: NVDA price appreciation of 8.4% in a single session on 145% of average relative volume.
Critical Data
Institutional accumulation is evident in the options flow and dark pool prints. The call-to-put ratio for the March 2026 expiry has compressed to 0.62, signaling aggressive upside positioning by hedge funds.
| Metric | Current Status | Implication |
|---|---|---|
| Market Capitalization | $4.02 Trillion | Institutional Dominance |
| Relative Volume (RVOL) | 1.45x | High Conviction Breakout |
| 14-Day RSI | 74.2 | Overbought / Momentum Extension |
| Implied Volatility (IV) | 48% | Premium Expansion |
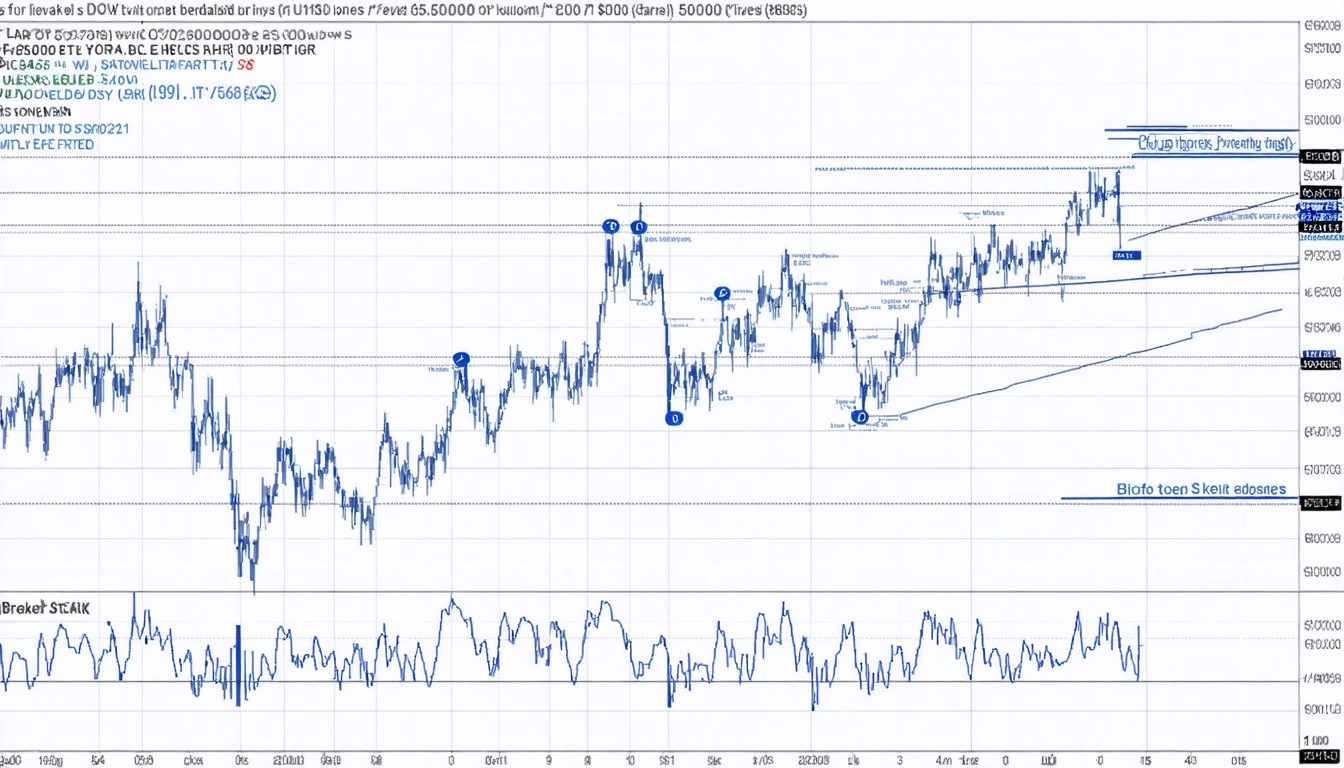
Execution Plan
The technical structure shows a definitive breakout from a three-month consolidation range. Price is currently trading above the 2.618 Fibonacci extension. Traders should anticipate a retest of the $158.00 breakout point before further expansion. The primary upside target is $182.00, derived from the measured move of the previous flag pattern.
Watchlist: NVDA, TSM, AVGO.
To validate these levels with custom indicators, check the Chart Analyzer or set automated monitors via TradingWizard Bots.
FAQ
Is NVDA overvalued at a $4 trillion market cap?
Valuation is high but supported by a forward P/E ratio that remains below its 5-year peak due to triple-digit earnings growth. The structural shift toward sovereign AI infrastructure provides a floor for demand.
What is the primary risk to the $182.00 target?
The primary risk is a macro liquidity drain if the Federal Reserve pivots back to a hawkish stance following the recent 2.4% CPI print. A break below $148.50 invalidates the current bullish thesis.