
Why this matters now
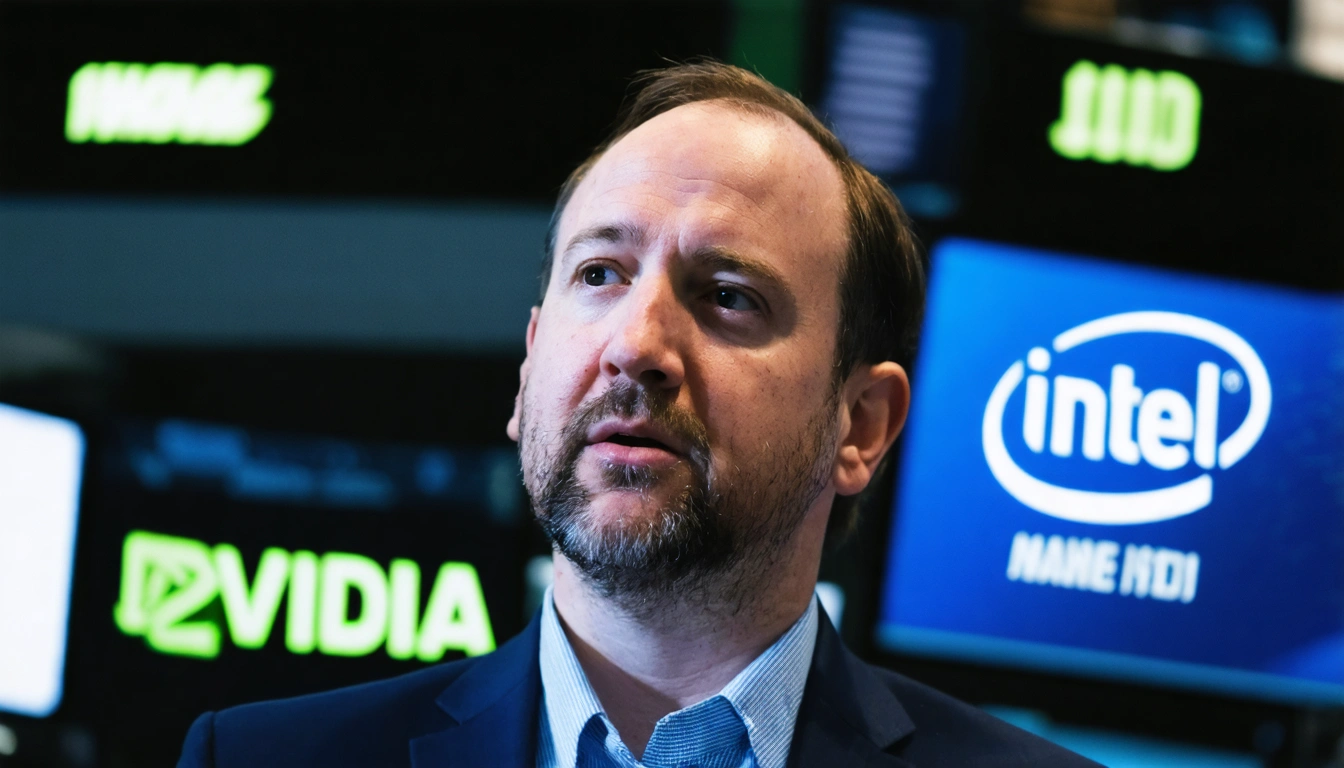
On September 18–19, 2025 U.S. equities extended a sharp rally to record highs after the Federal Reserve cut interest rates by 25 basis points and market-moving corporate activity — most notably Nvidia announcing a roughly $5 billion stake in Intel — sent semiconductor names higher and catalyzed broad risk-on flows. See reporting on September 18–19, 2025 from Reuters and analysis in the Financial Times.
- Fed action: 25 bps cut priced/announced and commentary signaling scope for additional easing moved rate expectations materially on September 17–18, 2025. (Market pricing showed ~44bp cuts priced by end-2025). Source: Reuters.
- Market reaction: S&P 500 and Nasdaq closed at fresh records on Sept 18–19 (S&P ~6,631.96 on Sept 19 close per Reuters). Semiconductor index jumped ~3.6% intraday as Nvidia/Intel news circulated. Reuters, Nasdaq reporting.
- Flow context: small-cap Russell 2000 hit its first record close since November 2021, signaling liquidity breadth; but analysts warn of concentrated valuation risk in AI leaders. Source: FT, Nasdaq.
Trading playbook
- Signal: VWAP reclaim on a 5–15 minute chart + ATR(14) expansion above the 10-day ATR mean. Use this combo to separate a real momentum continuation from a headline spike.
- Entry: On a 1–5 minute pullback to VWAP after a breakout, enter when price closes back above VWAP and volume > 1.2x 20-period average. For swing trades, use daily close above prior value area high (VAH) + RSI < 80.
- Stop: Intraday: 1.0–1.5x ATR(14) below entry (use volatility-adjusted stops). Swing: invalidate on close back below prior-day low or 3% below entry — whichever is smaller to control downside.
- Targets: Ladder targets: 1R take partial profit, trail stop to breakeven + 0.5R; target 2R for full exit. For semiconductors, use prior measured move (breakout height) for target if that gives >1.5R.
- Management: If the Fed or major economic releases are within 24 hours, reduce size by 25–50% or use options to hedge. Move stops to trail by 0.75x ATR after first target. If volume dries on continuation, take profits — rallies on easing can be snapback-prone.
Quick automation: run sector scans for semiconductors and small-caps, then filter by VWAP/ATR signals inside TradingWizard.ai. Use Chart Analyzer to generate structure and measured moves, and deploy alerts or execution bots via Algo AI Trading Bots. Check pricing or learn the exact setup in the academy.
Risk, mistakes, and pro tips
- Position sizing: risk 0.5–1.0% of portfolio per trade in this late-cycle rally; if implied vols compress, prefer lower size (0.25–0.5%).
- Common traps: chasing first-day spikes in headline names (NVDA/INTC) — these can gap and reverse intraday; ignoring liquidity (wide spreads, low ADV) in smaller semis; trading into unscheduled headlines (BLS delays, geopolitical tweets).
- Pre-trade checklist: trend (higher timeframe), volume confirmation, VWAP status, ATR vs 10-day mean, stop and target in place, news window checked, liquidity assessed.
- Options edge: use short-dated calls for directional exposure after a confirmed reclaim (delta 0.4–0.6), or buy cheap protection (OTM puts) if holding overnight through macro risk.
| Signal | Interpretation |
|---|---|
| VWAP reclaim + volume | High-prob continuation intraday |
| ATR14 > 10-day avg | Volatility breakout; widen stops accordingly |

FAQ
Is this rally likely to continue after the Sept 18–19, 2025 Fed cut?
Short-term continuation is possible while markets price further easing and AI/corporate catalysts persist. But monitor breadth and flows — concentration in a few mega-cap AI names raises correction risk. Watch inflation prints and payrolls for direction.
How big should my position be in semiconductors now?
Use volatility-adjusted sizing: risk 0.5–1% of capital per trade; if ATR indicates high volatility, size toward 0.5%. Prefer partial profits and trailing stops in this environment.
Which tools should I use for quick decisions?
Use Chart Analyzer for structure (VWAP, ATR, value areas), run real-time scans in the app, and trigger automations with Algo AI Trading Bots.
Sources
Ready to act? Open TradingWizard.ai, analyze a chart in seconds with Chart Analyzer, and turn signals into structured plans or automate execution with Algo AI Trading Bots. Check pricing and the academy for the exact setups.