The Catalyst
On February 11, 2026, the Federal Reserve maintained the benchmark interest rate at 3.75%. While the hold was priced in, the accompanying geopolitical shift regarding Russian trade settlements triggered a violent de-risking event in precious metals. The reported pivot by Moscow to resume U.S. Dollar settlements for energy exports has effectively neutralized the "de-dollarization" premium that supported gold's 2025 rally.
- Event: Federal Reserve Rate Hold (3.75%) + Russia USD Pivot.
- Reaction: Gold (XAU) -4.2%; DXY +0.85% to 105.20.
Critical Data
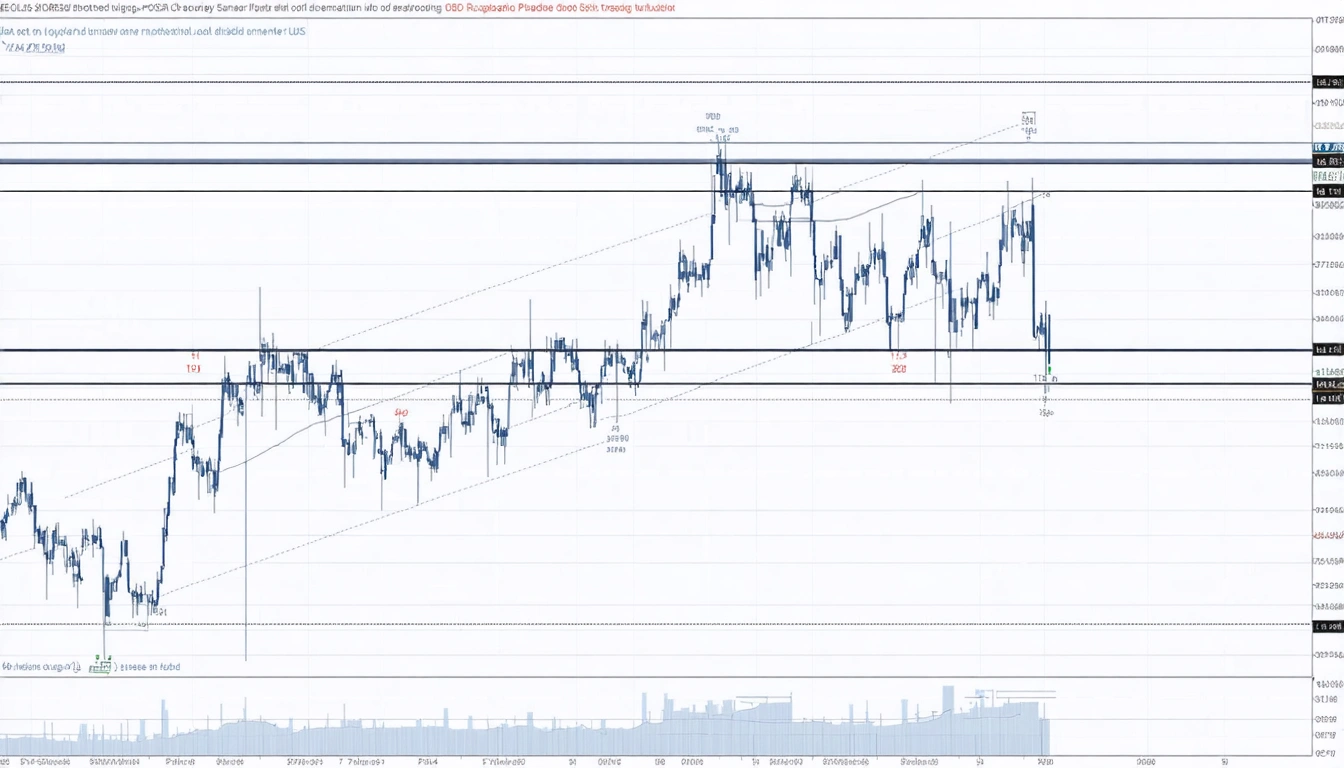
Institutional flows shifted aggressively on February 12, 2026. Comex Gold futures saw a surge in volume, with over 340,000 contracts traded as long positions were liquidated. The correlation between Gold and the 10-year Treasury yield has tightened, as the "higher for longer" narrative gains traction following the Fed's hawkish pause.
| Metric | Current Status | Implication |
|---|---|---|
| Spot Gold (XAU/USD) | $2,635.40 | Bearish Breakdown |
| US Dollar Index (DXY) | 105.20 | Structural Strength |
| 10Y Treasury Yield | 4.42% | Headwind for Bullion |
Execution Plan
The technical structure for Gold has shifted from "buy the dip" to "sell the rip." The $2,680 level, previously support, now acts as primary overhead resistance. A failure to reclaim $2,680 on a daily closing basis confirms a move toward the psychological $2,600 floor. Short-sellers should look for exhaustion at the $2,655-2,665 zone.
Watchlist: XAU/USD, GDX (Gold Miners ETF).
To validate these levels with custom indicators, check the Chart Analyzer or set automated monitors via TradingWizard Bots.
FAQ
Why did Russia's USD pivot crash Gold?
Gold's recent premium was driven by central bank diversification away from the USD. Russia's return to dollar settlements signals a reduction in geopolitical fragmentation, lowering the demand for gold as a neutral reserve asset.
Is the $2,600 level a safe entry for longs?
Data suggests $2,600 is a high-volume node. However, with the Fed holding rates at 3.75% and inflation remains sticky, the real yield environment is unfavorable for non-yielding assets. Wait for a volatility squeeze before entering.