The Catalyst
The disinflation narrative suffered a structural setback on February 20, 2026. The Bureau of Economic Analysis reported Core PCE—the Federal Reserve's preferred inflation metric—at 2.9% year-over-year. This follows the February 18 release of FOMC minutes which already signaled "significant hesitancy" regarding further rate cuts. The confluence of hawkish rhetoric and hot data has effectively priced out a March rate cut.
- Event: January Core PCE Price Index Release (Feb 20, 2026).
- Reaction: Immediate repricing of the terminal rate; 2-Year Yields jumped to 4.72%.
Critical Data
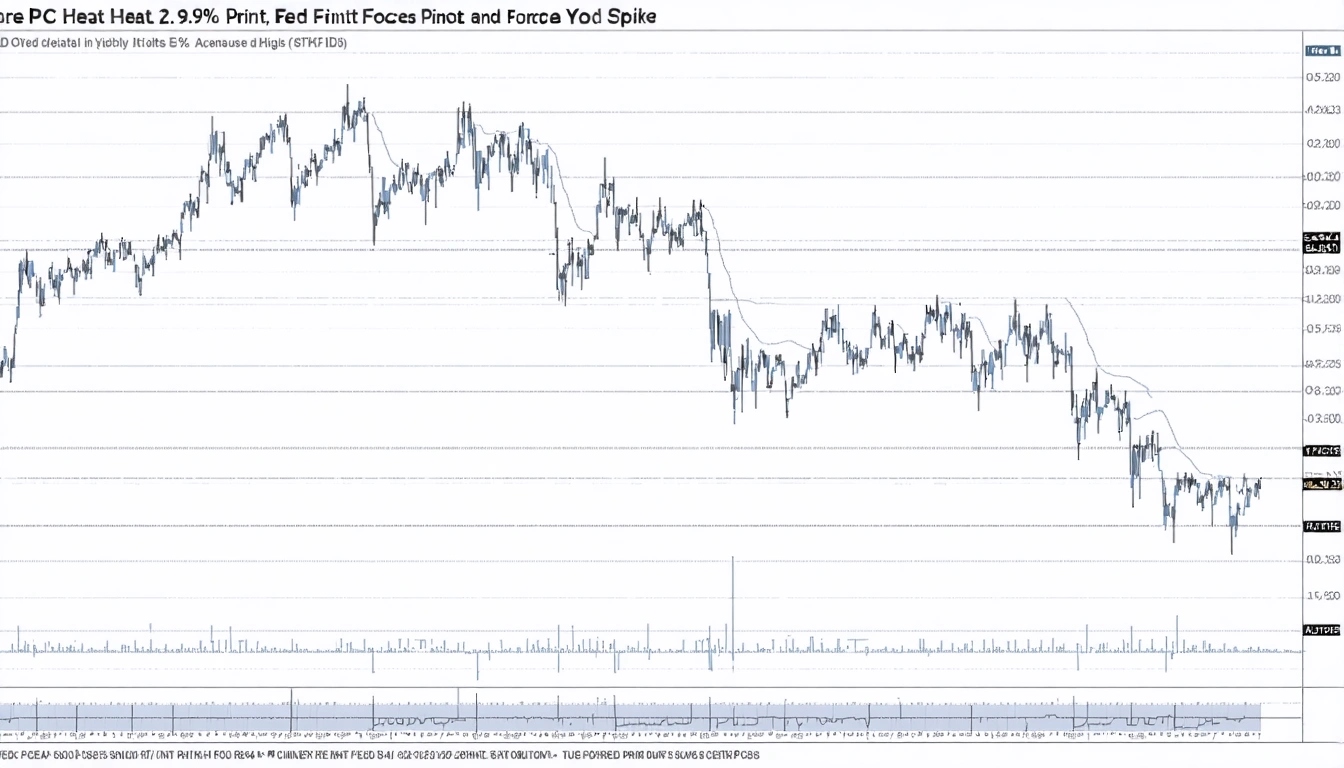
Institutional flows are rotating out of growth equities as the "risk-free" rate climbs. The spread between the 2-year and 10-year notes narrowed, suggesting the market is bracing for a restrictive environment through H2 2026.
| Metric | Current Status | Implication |
|---|---|---|
| Core PCE (YoY) | 2.9% (Actual) vs 2.6% (Exp) | Bearish Equities |
| 10Y Treasury Yield | 4.45% (+15bps) | Bearish Tech/Growth |
| DXY (Dollar Index) | 105.40 (+0.8%) | Bullish USD |
Execution Plan
The immediate trade is a short-side play on high-multiple indices. The S&P 500 has broken below its 21-day EMA. We look for a retest of the 5,850 level. Invalidation occurs on a daily close above 6,010. For currency traders, Long USD/JPY remains the preferred carry play as the yield differential widens.
Watchlist: SPY, QQQ, USD/JPY.
To validate these levels with custom indicators, check the Chart Analyzer or set automated monitors via TradingWizard Bots.
FAQ
Why did the 2.9% PCE print cause such high volatility?
The market was positioned for a "soft landing" with inflation trending toward 2%. A 2.9% print suggests inflation is sticky, forcing the Fed to maintain higher rates for longer, which compresses equity valuation multiples.
Is the 10-Year Yield at 4.45% a ceiling?
Technically, 4.50% represents a major psychological and structural resistance level. A break above 4.50% would likely trigger a deeper liquidation in the Nasdaq 100 as discount rates are adjusted upward.