Why Cycle Timing Works
Markets often oscillate between expansion and contraction, accumulation and distribution. While prices don’t repeat perfectly, the time between meaningful swing lows frequently clusters within a range. When you measure those intervals and average them, you get a probabilistic window for the next potential low. That window becomes a planning tool: it tells you when to pay closer attention, not what to buy or sell.
- Focus on time—a cleaner dimension than price guessing.
- Use timing windows to prepare scenarios and if/then rules.
- Pair with structure (HH/HL or LH/LL), S&R, liquidity and orderflow.
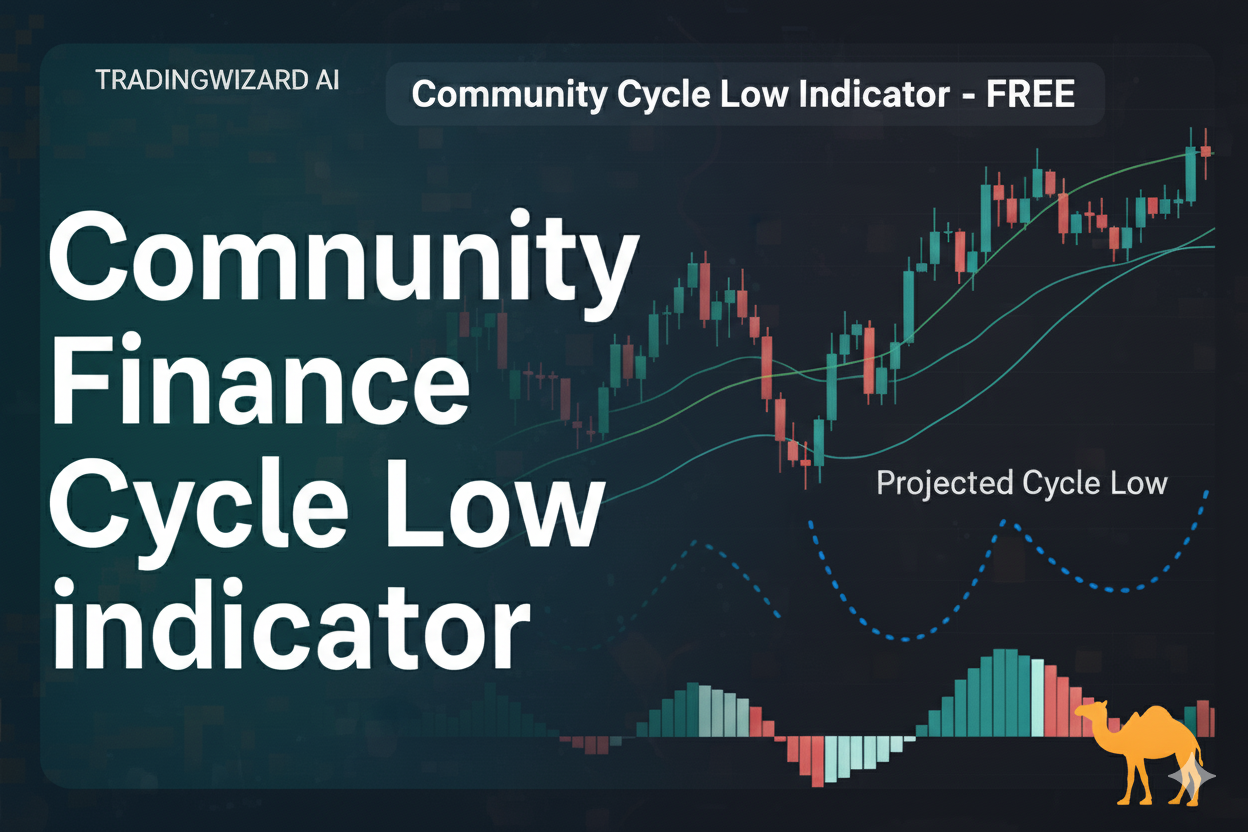
Indicator Basics: What It Plots & Why
The CF Cycle Low Projection V2 from TradingWizard AI detects significant pivot lows, calculates the average distance (in time) between recent lows, and projects a forward ETA for the next likely low. You can optionally enable cycle-high projections in settings. The chart shows:
- Pivot markers: Red/green triangles anchored to candles for confirmed pivots.
- ETA line: A vertical line at the projected next cycle low (and optional high).
- Timing window: A shaded box around the ETA based on either k·stdev or a percentage of the average interval.
- HUD: Status, ETAs, intervals used, and active filters.
- Cycle length row (optional): Weeks text above and icon below, anchored to the pivot bar for quick scanning.
By default, cycle-low projection is enabled. To also project cycle highs, toggle Cycle High Projection on in the indicator settings.
The Cycle Timing Playbook (Step-by-Step)
- Select timeframe: Works intraday to higher TFs. More data = cleaner intervals; start with 1H/4H/D.
- Let pivots accumulate: Once the HUD shows “OK,” projections begin. Intervals become more stable after 10–20 pivots.
- Mark your map: Note the ETA line + timing window. This is your “attention zone,” not a signal.
- Wait for structure: Near/inside the window, look for HL structure, sweep-and-reclaim of a level, or momentum shift.
- Define invalidation: Place the stop where the idea is wrong (e.g., below the sweep low or structure break).
- Plan exits: Scale at 1R/2R and trail the rest using structure or VWAP/EMA. Don’t overstay if conditions decay.
Quick Reference
| Item | Rule of Thumb |
|---|---|
| Intervals (N) | Start 10–20 pivots; widen on noisy pairs |
| Window mode | k·stdev for adaptive; %-of-avg for simplicity |
| Trigger | HL reclaim, liquidity sweep + close back in, or momentum flip |
| Stops | Below invalidation wick or structure break |
| Targets | 1R/2R partials; trail with structure/VWAP |
Pro Filters: Structure, Volatility & Liquidity
- Structure: Favor longs when higher-timeframe bias is up (HL/HH), shorts when it’s down (LH/LL). Confirm with SR flips.
- Volatility guardrails: Use ATR-based filters to avoid dead tape or wild chop; tune the indicator’s ATR and %-move filters.
- Liquidity: Prefer instruments with stable spreads and depth. “Easy to enter” is “easy to exit.”
- Confluence: Timing window near HTF demand/supply, VWAP bands, or key session levels increases quality.
Five High-Quality Setups
1) Sweep & Reclaim into the Window
Price wicks below a prior low near the timing window, then closes back above. Enter on the reclaim, stop under the sweep.
2) Structure Flip + Retest
Down-trend transitions to HL/HH inside the window. Buy the first clean retest of the flipped level; invalidation under the retest low.
3) Divergence Assist
Momentum divergence near the window adds confluence—enter on the first strong candle close with tight stop.
4) Trend-Aligned Pullback
In an up-trend, time pullbacks with the window and buy the first HL; opposite for shorts if using cycle-high projection.
5) Multi-TF Stack
Window on 4H aligns with a Daily swing level. Enter on 1H confirmation; manage on 15m/1H. Let the higher TF do the heavy lift.
Risk, Sizing & Common Traps
- Keep risk small: Many pros cap 0.5–2% per trade.
- No “knife catching” without rules: Timing ≠ signal. Wait for structure and invalidation.
- Respect volatility shifts: If ATR explodes, widen stops or skip. If ATR dies, reduce expectations.
- Avoid overfitting: Don’t tweak N or filters to fit one chart. Optimize by asset class and timeframe.
- Journal the window: Log how price behaves inside vs. outside; refine your triggers.
Automation with TradingWizard.ai
Turn cycle timing into a repeatable, semi-automated workflow:
- Chart Analyzer: Paste a chart; get structure, levels and timing context in seconds. Open Chart Analyzer
- Algo AI Trading Bots: Set “when/then” rules around the timing window (alerts on reclaim, HL confirmation, volume filter). Explore Bots
- Scale the routine: Same template across watchlists; let bots wait, you execute.
FAQ
Does the indicator predict price?
No—it projects time windows. Use structure/S&R/liquidity for entries and invalidation for risk.
Which timeframe is best?
Start with 1H/4H/D for cleaner intervals. Drop to 15m/5m for execution once the window is near.
How many intervals (N) should I average?
10–20 recent pivots is a good baseline. Increase N for choppy assets; reduce for faster-cycling pairs.
Can I project cycle highs too?
Yes—enable Cycle High Projection in settings. Same logic, mirrored for highs.
Credits & Notes
Built by TradingWizard AI (tradingwizard.ai). Inspired by the “camel finance” style of cycle timing—but this tool is free (not $29/month). Use it, refine it, and share your playbook with the community.
Try the indicator on TradingView: CF Cycle Low Projection V2