Celestia (TIA/USDT) Daily Analysis: Bullish Reversal in Sight?
Celestia (TIA/USDT) Daily Analysis: Bullish Reversal in Sight? Key Support and Resistance Levels, Elliot Wave Insights, and Fibonacci Targets for Traders.

Welcome to today's technical analysis of Celestia (TIA/USDT). As traders, we constantly seek patterns, support and resistance levels, and indicators that help us make informed decisions. Today, we will dive deep into the potential bullish reversal for TIA/USDT on the daily chart. Let’s get started!
Trend Analysis
- Timeframe: Daily
- Trend: Bearish transitioning to Bullish
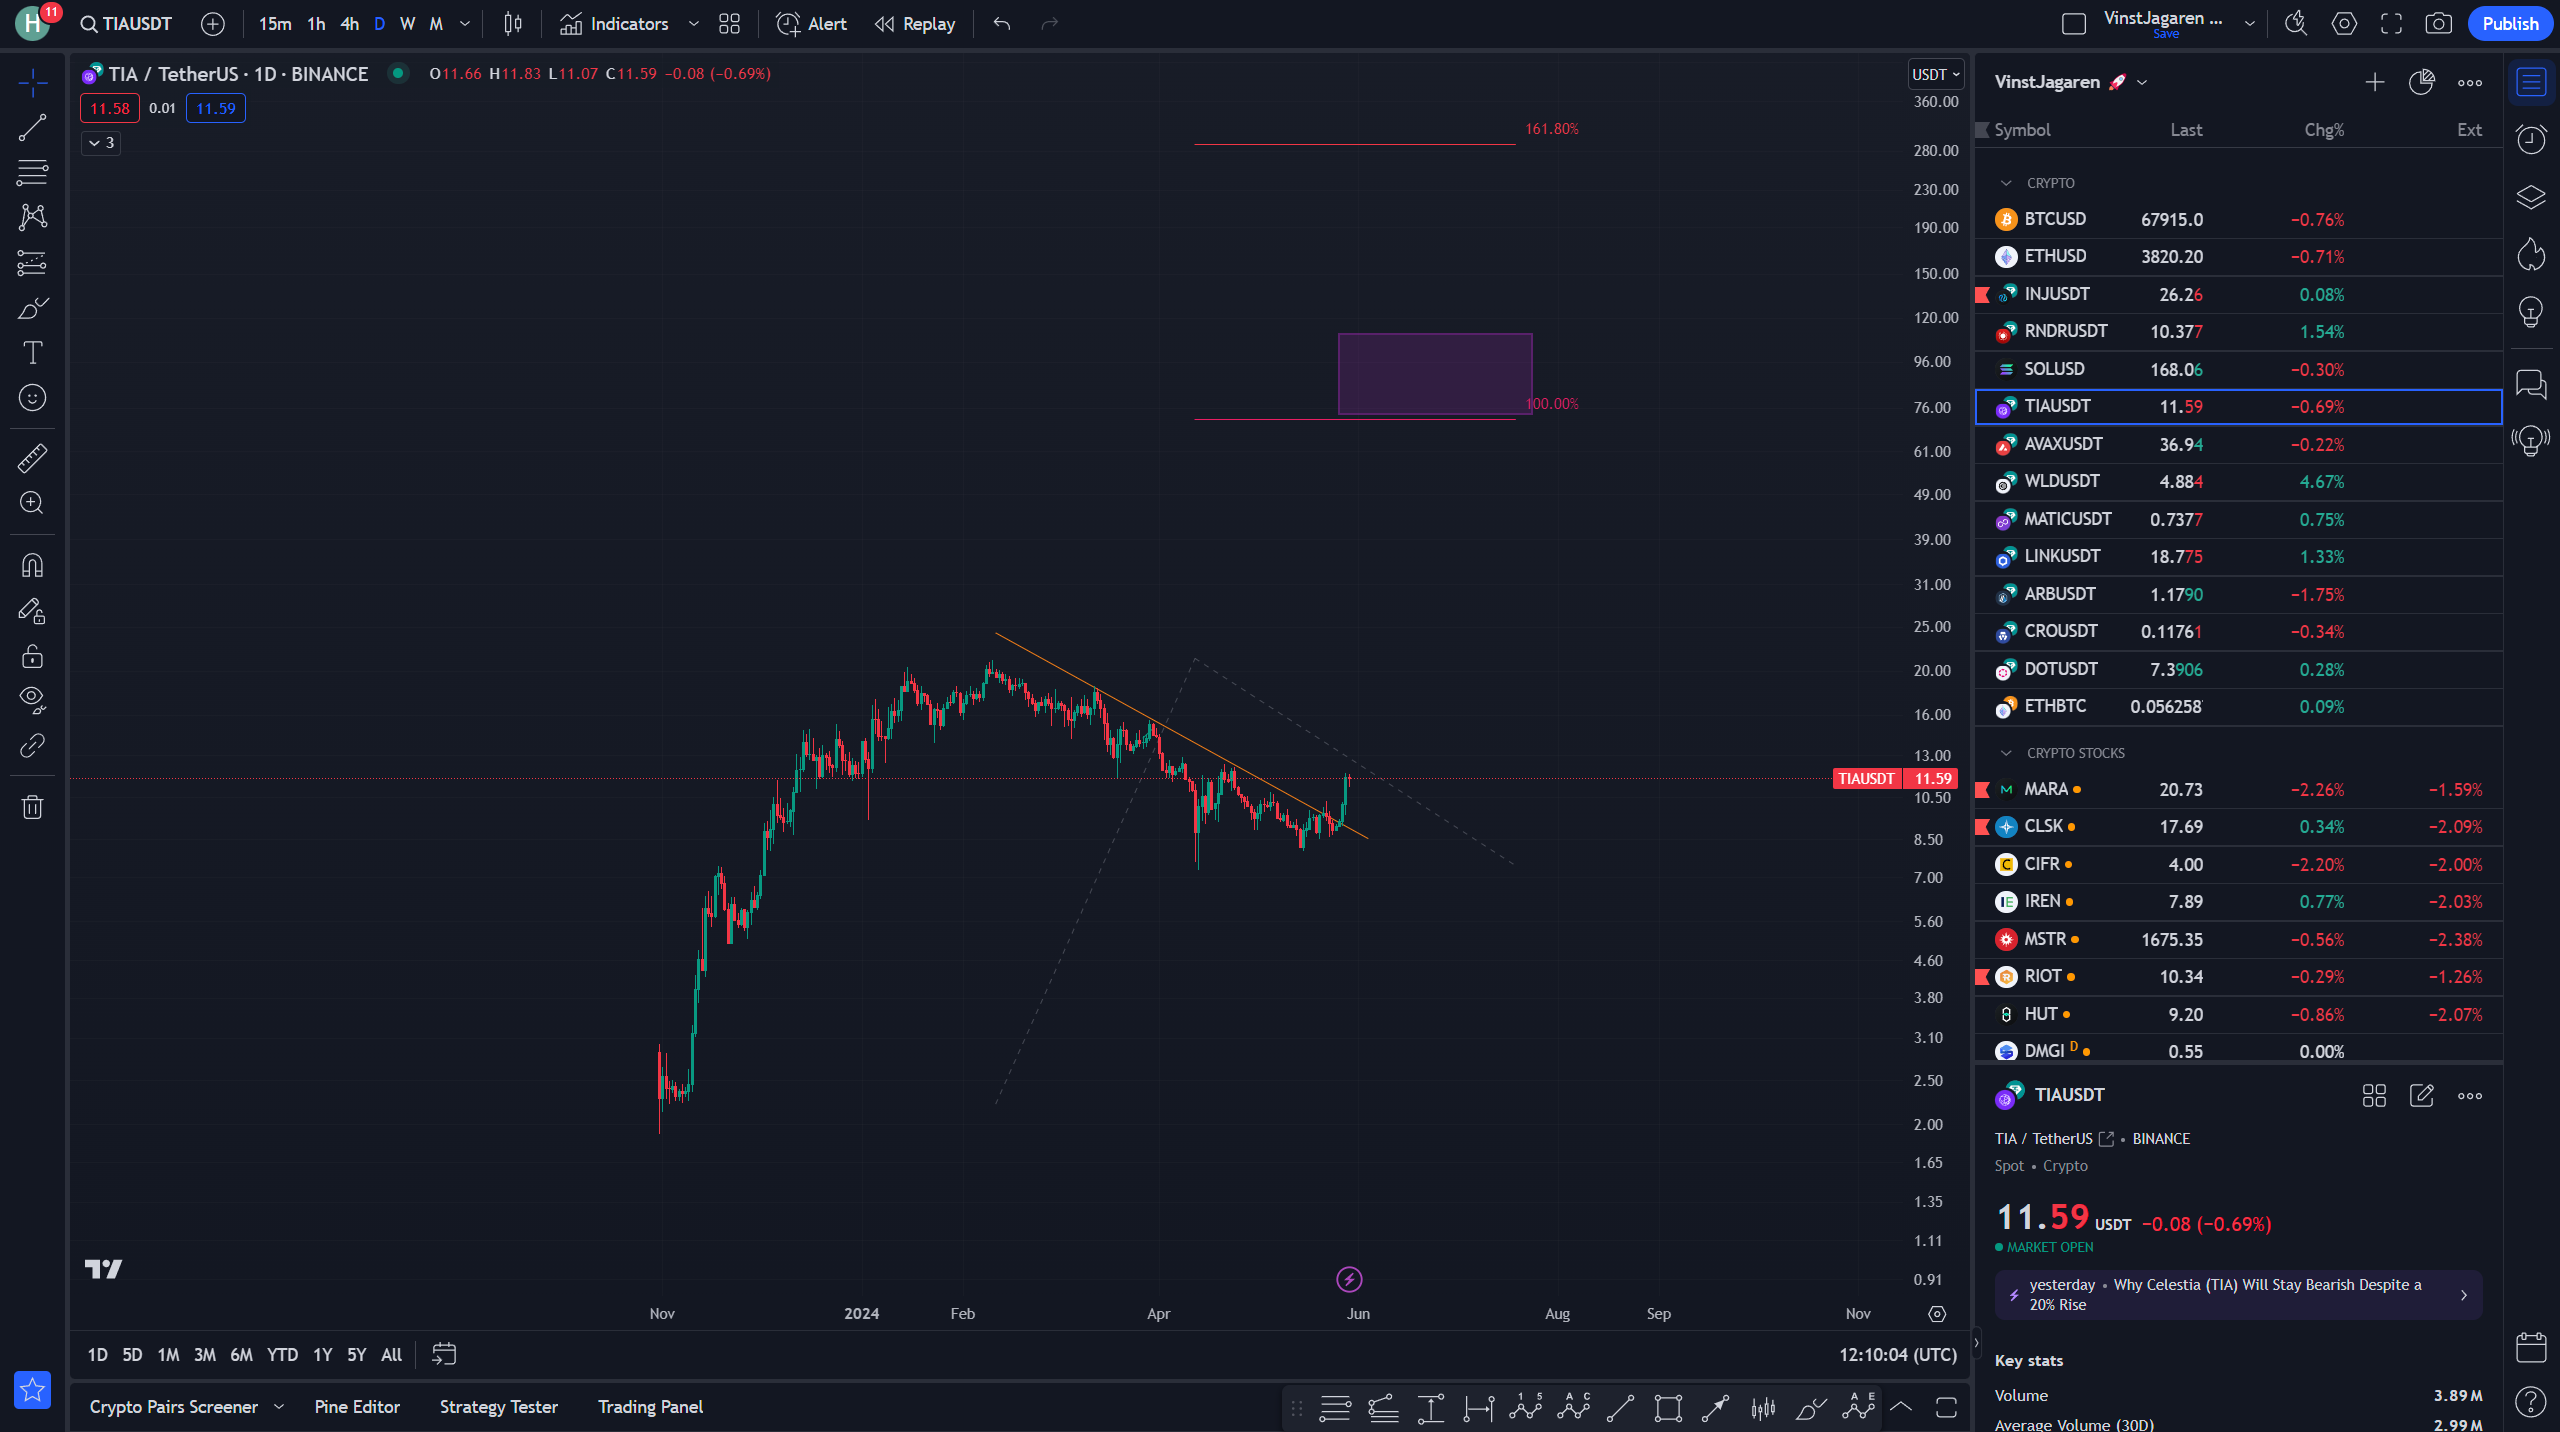
For a considerable period, TIA/USDT has been in a downtrend, indicated by a descending trendline. However, recent movements suggest a potential trend reversal. The trend analysis shows a breakout attempt, which might indicate the emergence of a bullish trend.
Support and Resistance Levels
Understanding support and resistance levels is crucial for any trader. Here are the key levels to watch for TIA/USDT:
| Support Levels | Resistance Levels |
|---|---|
| $10.50 | $13.00 |
| $8.50 | Around $18.00 |
The $10.50 level has been tested multiple times and remains a strong support. Additionally, the $8.50 level has held up in past tests, providing another critical support zone.
On the resistance side, $13.00 is the breakout point. If this level is breached, it signifies a strong bullish movement. The $18.00 zone is another significant resistance, tested multiple times previously.
Price Movement
Recent price movements have been promising. TIA/USDT has broken out of a descending channel, which is a bullish signal. We expect consolidation around current price levels before potentially moving towards the next resistance levels. A move above $13.00 would confirm a further bullish trend.
Elliot Wave Theory
Applying the Elliot Wave Theory, the chart potentially illustrates the end of a corrective wave (abc) and the beginning of a new impulse wave (1) upwards:
- Waves 1-5 could be forming with Wave 1 potentially just starting.
Cycle Analysis
Cycle analysis helps in identifying the highs and lows over different periods:
- Weekly Lows/Highs:
- Recent low around late April: $9.20
- Recent high in mid-February: $15.00
- Monthly Lows/Highs:
- Historical data between $10.50 low and $18.00 high.
- Upcoming Cycles: Based on the highs and lows, expect a potential high around mid-June, aligning with prior patterns and breakout attempts.
Algo Zones (Fibonacci Levels)
Fibonacci levels provide potential resistance and retracement zones:
Fibonacci Resistance Levels:
- 100%: Around $18.00 (Significant previous high)
- 161.80%: Projected at around $24.00
Potential Retracement Levels:
- $11.00 (23.6% Fib)
- $13.00 (38.2% Fib)
Targets
Setting targets helps in planning trades:
- Short-Term: $13.00 - Expected to be tested and potentially broken. Reason: Breakout confirmation needed.
- Medium-Term: $15.00 - Middle resistance level with historical significance.
- Long-Term: $18.00 - Major resistance and Fibonacci 100% level. Target frame mid-2024 if bullish trend follows through.
Conclusion
A potential bull trend is emerging for TIA/USDT given the recent breakout from the descending channel. The key levels to watch are $13.00 for short-term breakout confirmation and then $15.00 and $18.00, reflecting medium to long-term targets. The growing positive momentum and cycle patterns indicate a favorable outlook. Monitor the support levels at $10.50 and $8.50 carefully, as these will provide crucial insights into any potential downward risks.
For more insights into trading strategies and tools, explore our articles on day trading and Ethereum. Additionally, you can enhance your trading analysis by using Kai, your personal TradingView AI companion. Kai helps in becoming a better trader by providing in-depth analysis directly from your TradingView chart.
Stay tuned for more updates and happy trading!