BTCUSD Weekly Chart Bullish: $100K Target in Sight
BTCUSD Weekly Chart Bullish: $100K Target in Sight - Technical Analysis Reveals Key Support, Resistance Levels, and Wave Theory Insights for Potential Breakout.

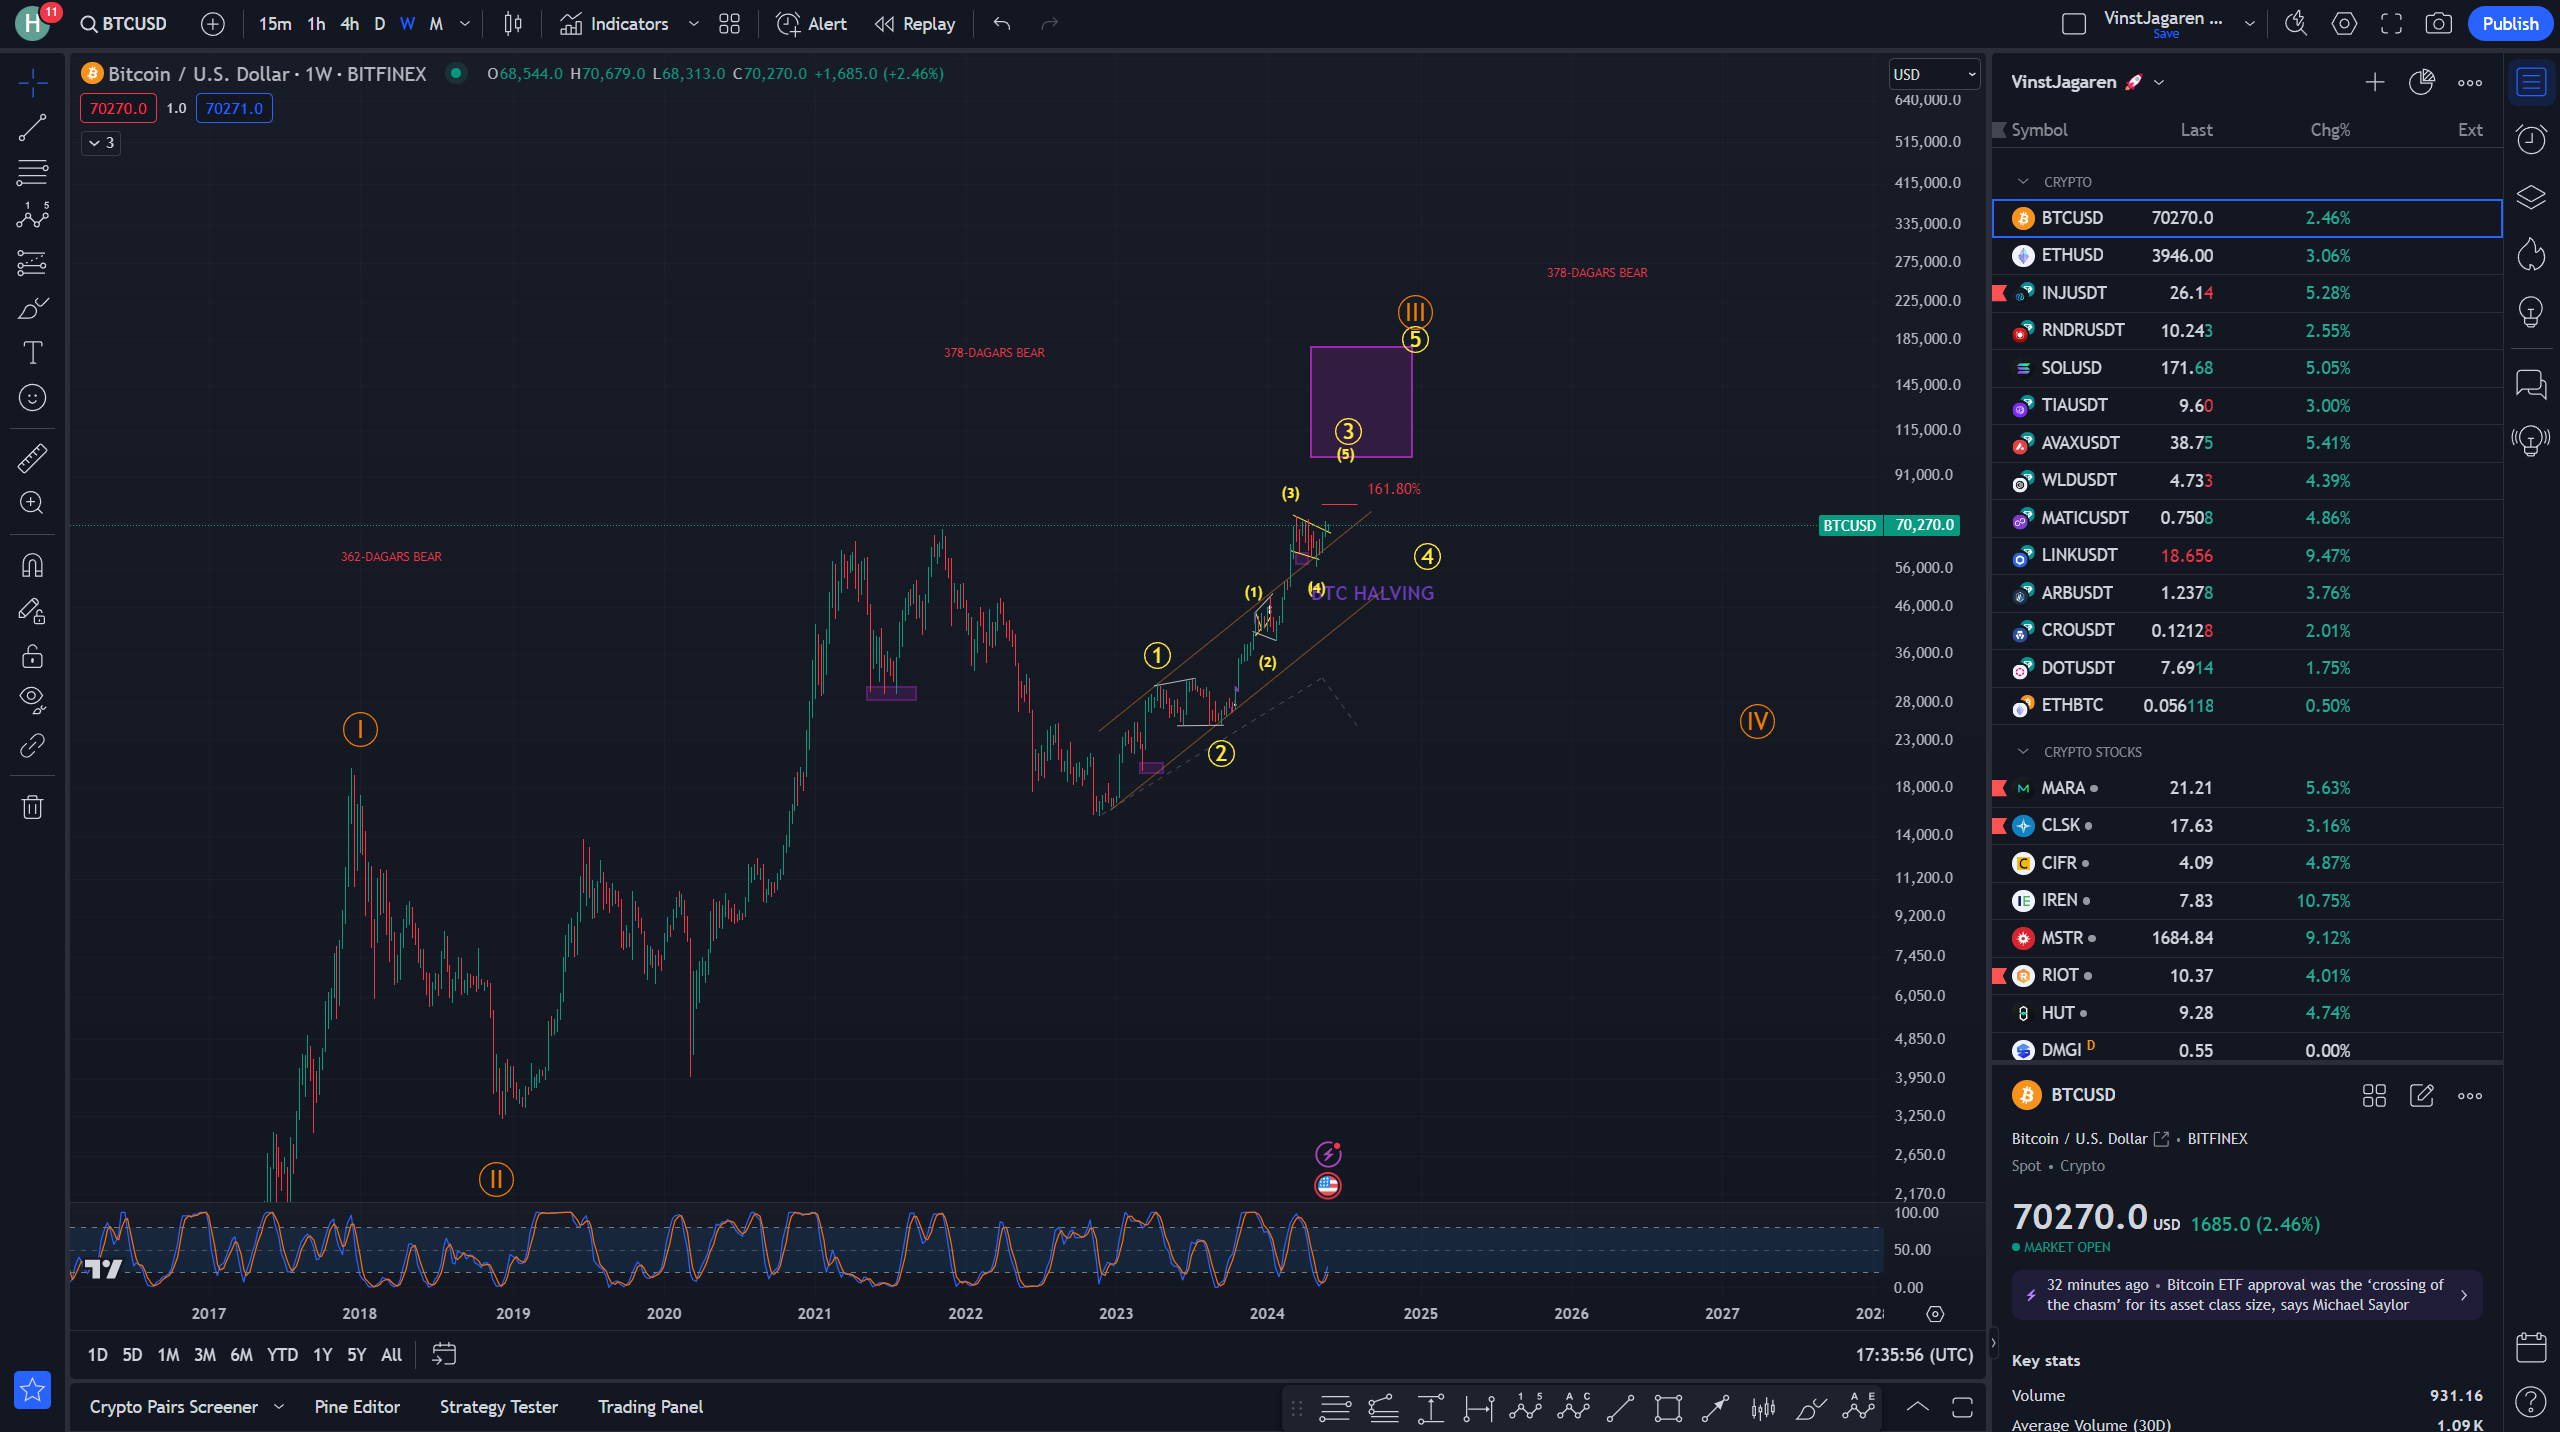
As we delve into the technical analysis of BTCUSD on the weekly chart, it's clear that Bitcoin is exhibiting a strongly bullish trend. This analysis will explore key support and resistance levels, Elliot Wave theory insights, and potential price targets, indicating that Bitcoin could be on its way to $100,000 and beyond.
Trend Analysis
The Bitcoin chart on the weekly timeframe shows a clear upward trajectory. The price has successfully broken through significant previous resistance levels, confirming a bullish trend. The breakout is supported by substantial trading volumes, further solidifying the bullish sentiment.
Support and Resistance Levels
- Support Levels:
- Around $45,000 (tested multiple times).
- Around $30,000 (tested multiple times).
- Resistance Levels:
- Around $70,000 (current level).
- Around $100,000 (projected based on Elliot Wave theory).
Given the provided levels, if the current resistance at $70,000 is tested multiple times, we could see a breakout, moving the price higher.
Elliot Wave Theory
According to the Elliot Wave theory, we are currently in wave (3) of a larger cycle. The smaller waves within this larger wave (3) denote wave 1 through 5, with wave 3 extending. We may expect a short correction leading to wave 4 before continuing upwards towards wave 5.
Cycle Analysis
When examining the weekly highs and lows, we observe that the previous bear and bull market cycles have been respected, with notable highs and lows. The bear market ended around November 2022, and we are roughly halfway through a new bull cycle. Given historic data, the next significant high might coincide with the timeline into late 2025 or early 2026, aligning with the typical 4-year cycle for large movements.
Algo Zones Based on Fibonacci Retracements
The key Fibonacci retracement level to watch is around 161.8%, which is approximately between $100,000 to $120,000. The chart price shows this level is respected, suggesting that Bitcoin could reach this zone in the near future.
Targets
- Short Term Target: $80,000 - $90,000
- Reason: Near-term upward momentum with a breakout of current resistance.
- Medium Term Target: $100,000
- Reason: Completion of wave (3) as per Elliot Wave theory and Fibonacci retracement zone.
- Long Term Target: $120,000 - $130,000
- Reason: Extended wave 5 completion within the ongoing bull cycle.
Conclusion
Bitcoin is strongly bullish on the weekly timeframe. The price action, combined with Elliot Wave theory and Fibonacci levels, suggests possibilities of further upward movement. Key supports at $45,000 and $30,000 provide a strong base, with resistances at $70,000 poised for potential breakouts towards higher targets.
Investors and traders should be cautious of the typical wave 4 correction but optimistic for continued bullish trends pushing Bitcoin towards and potentially beyond $100,000.
Enhance Your Trading with Kai
If you're looking to become a better trader, Kai, your TradingView AI companion, is here to help. Powered by OpenAI's GPT-4, Kai provides in-depth analysis of your TradingView charts, helping you gain valuable insights and speed up your trading analysis.
Here's how to use Kai:
- Click the "Add to Chrome" button and pin it to your toolbar.
- Log into your account.
- Go to TradingView and load your chart.
- Ask Kai and receive detailed trading analysis.
Kai includes toggles for various technical methods such as trend analysis, support and resistance levels, price movement, Elliot wave theory, cycle analysis, algo zones, and target indicator analysis. Whether you're interested in swing trading or comparing Bitcoin vs. Ethereum, Kai has got you covered.
Download Kai today and revolutionize your trading experience. 🚀