BTC/USD Daily Analysis: Bullish Trend, Key Targets & Wave Insights
BTC/USD Daily Analysis: Bullish Trend, Key Targets & Wave Insights - Discover support & resistance levels, Elliott Wave patterns, and Fibonacci targets to optimize your trading strategy.

In this comprehensive analysis of the BTC/USD daily chart, we delve into the bullish trends currently dominating the market. With detailed insights into support and resistance levels, Elliott Wave patterns, and Fibonacci targets, we aim to provide traders with the tools necessary to enhance their trading strategies.
Trend Analysis
- Timeframe: Daily
- Current Trend: Bullish
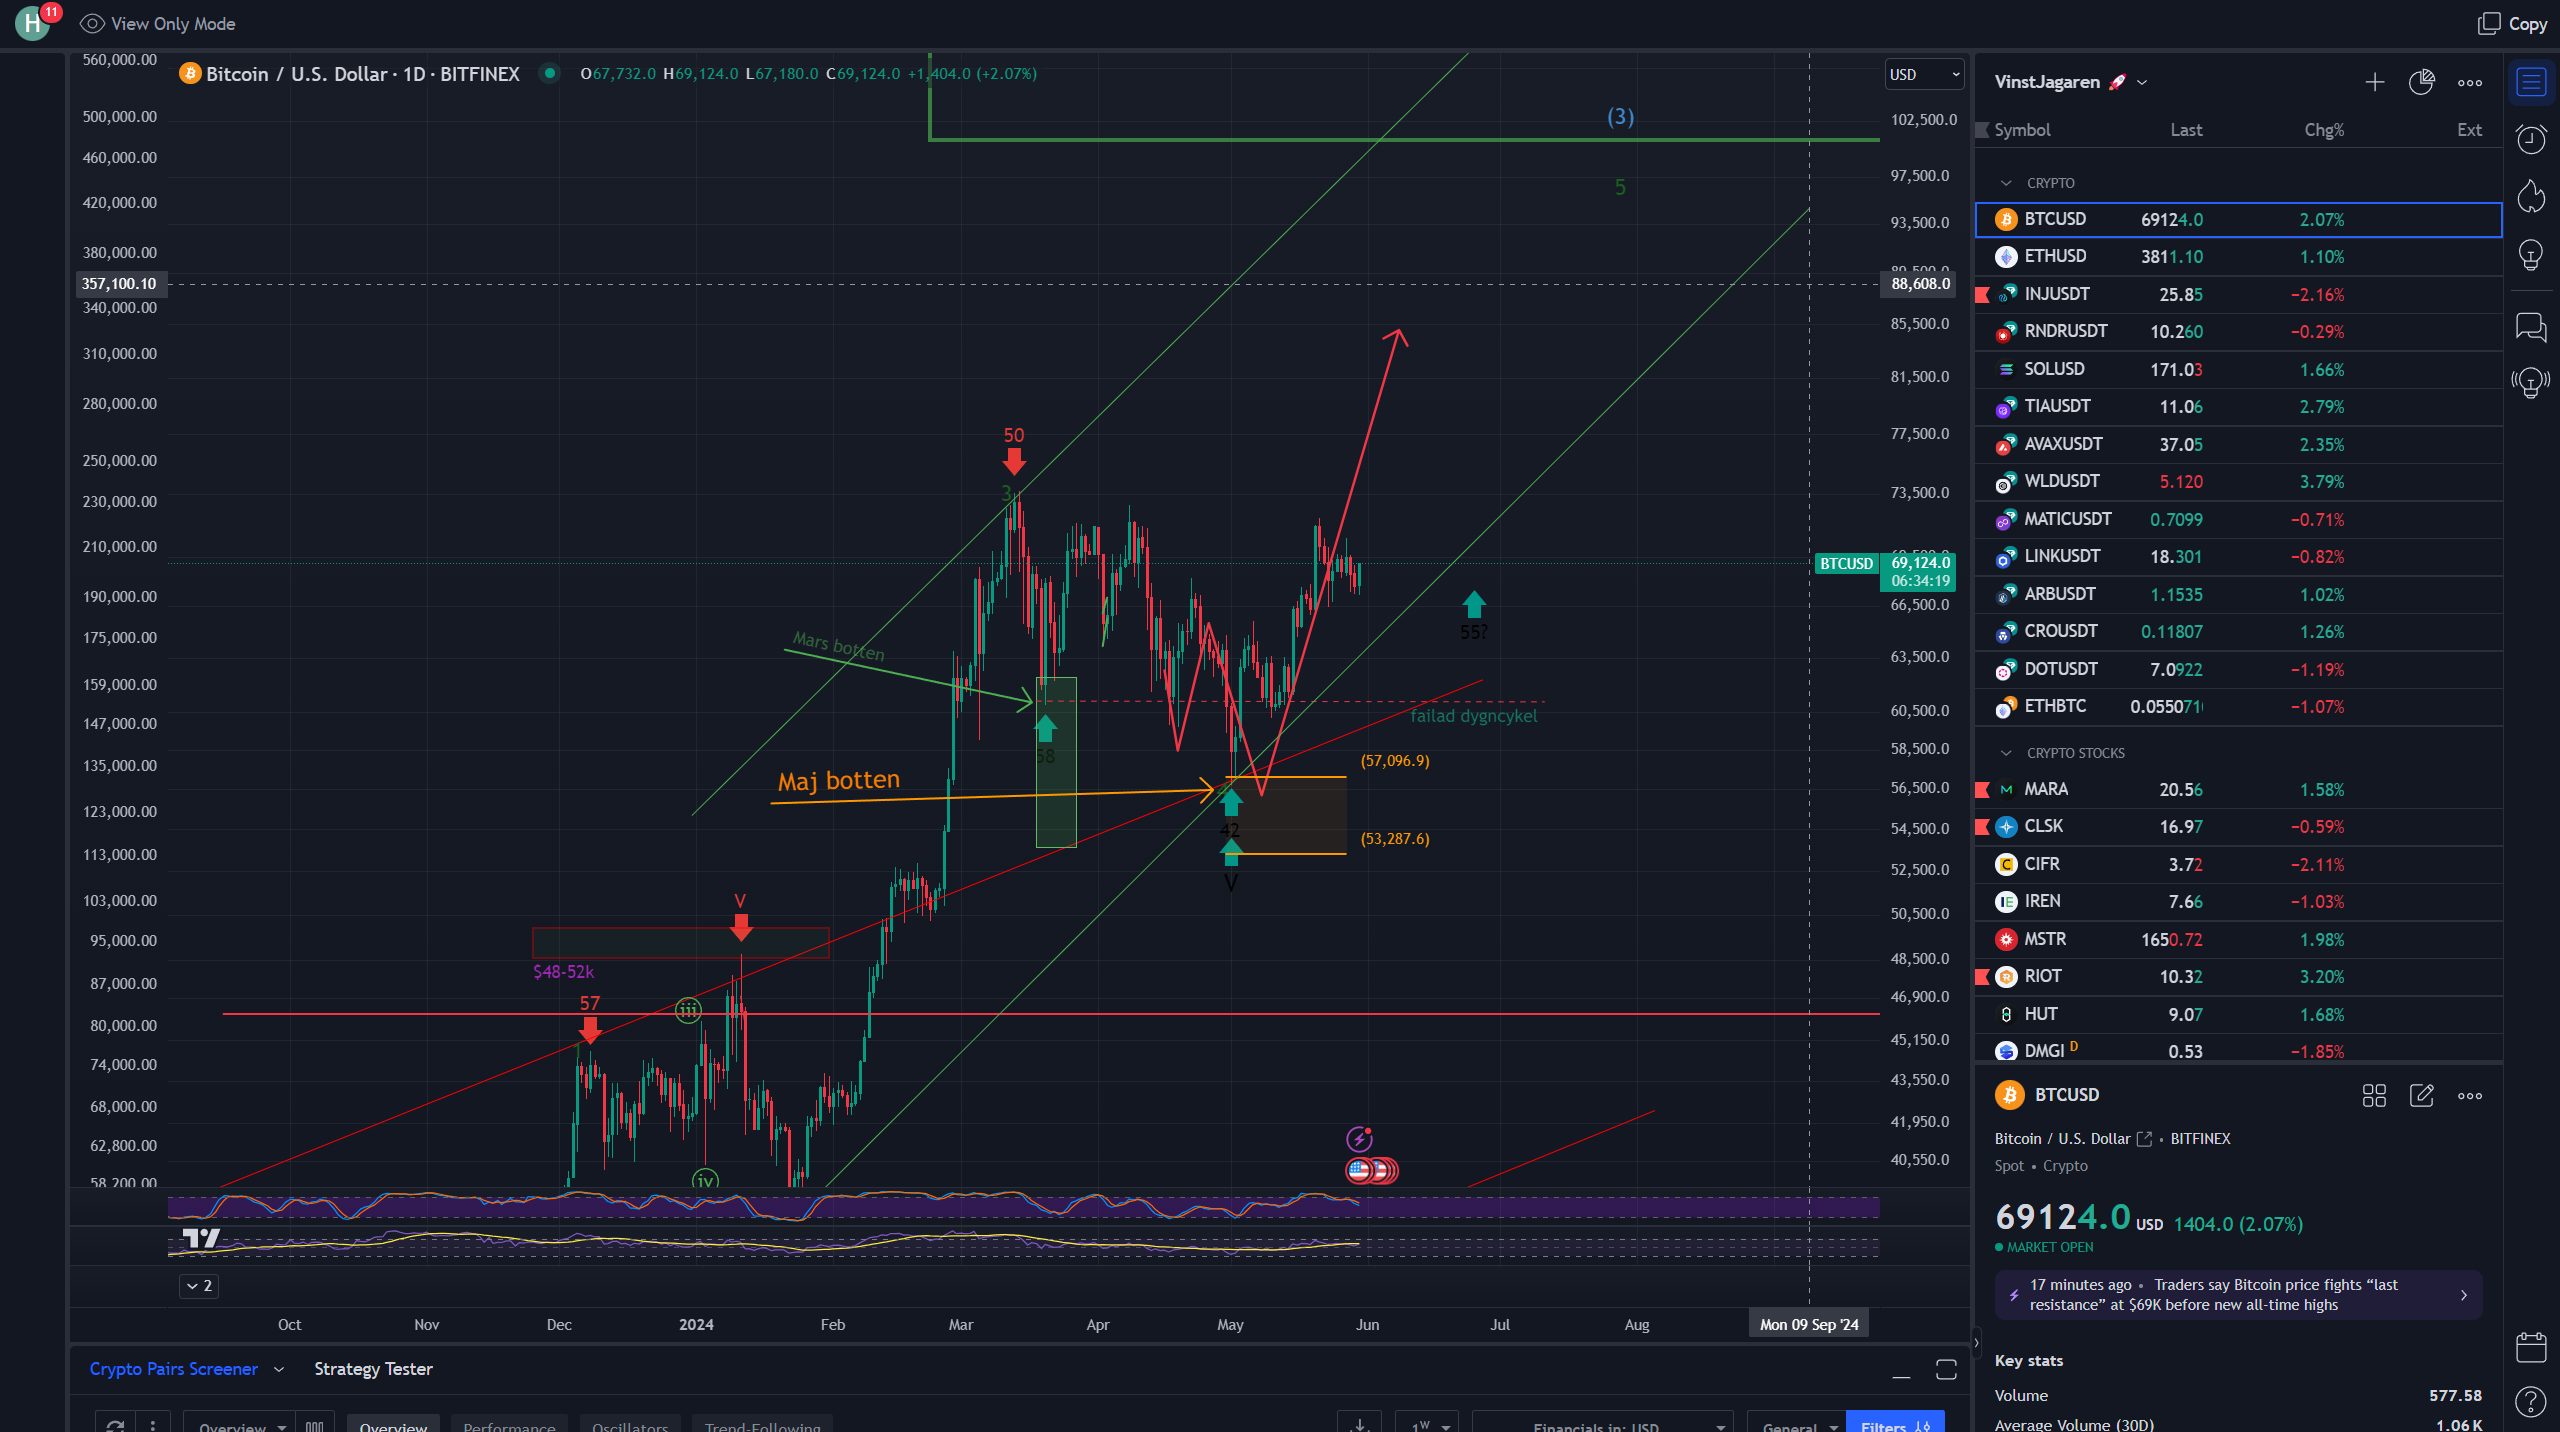
The BTC/USD pair has exhibited a strong upward movement, manifesting a bullish trend. The formation of higher highs and higher lows is evident in the chart, solidifying a bullish outlook.
Support and Resistance Levels
Identifying key support and resistance levels is crucial for any trading strategy. According to technical analysis, here are the pivotal levels to watch:
- Support Levels:
- $57,096.9 - This level has been tested multiple times, proving to be a strong area of buy interest.
- $53,287.6 - Another critical support level.
- Resistance Levels:
- $86,600 - A significant resistance level that the price has approached.
- $97,500 - Another major resistance level forecasted based on prior price peaks.
Price Movement
The price of BTC/USD has shown a consistent upward movement with minor corrections, indicating strong bullish sentiment. This aligns with our day trading strategies, which favor capitalizing on such trends.
Elliott Wave Theory
The chart indicates an Elliott wave pattern with waves labeled I-V, suggesting we are in a bullish wave cycle. Currently, wave 5 appears to be in progress, implying potential for further upward movement. For more information on this, you can explore swing trading techniques that rely on wave patterns.
Cycle Analysis
- Weekly Highs/Lows: The last major bottom was around the $48-52k range, and the price has moved upwards since.
- Monthly Highs/Lows: The average time between lows suggests an upcoming low could be projected if the current cycle holds.
Algo Zones Based on Fibonacci
Fibonacci retracement levels are key to understanding potential price movements. Important retracement levels to watch include:
- 0.618 fib at around $64,000, which acts as strong support.
- Potential fib extension targets might range from $97,500 to $102,500.
Targets and Reasoning
Based on the current bullish trend and various technical indicators, here are the potential targets:
- Short Term (Now to 1 month):
- Target: $77,500 - $83,000
- Reasoning: The nearing final wave completion and current bullish momentum make this range a reasonable short-term target.
- Medium Term (1 to 3 months):
- Target: $97,500 - $102,500
- Reasoning: This aligns with the projected Elliott wave 5 completion and fib extension targets.
- Long Term (6 months +):
- Target: $120,000 +
- Reasoning: Considering the bullish cycle, and if the current wave count is accurate, BTC could break previous highs and aim for new all-time highs.
Conclusion
The BTC/USD chart on the daily timeframe shows a strong bullish trend with multiple support levels confirmed and resistance levels to watch. The Elliott wave theory supports the continuation of a bullish cycle, with the final wave 5 in progress suggesting further upward potential. Based on Fibonacci levels and price action, short-term targets up to $83,000 and medium-term targets extending to $102,500 are reasonable. Long-term targets could be considerably higher if the bullish trend continues, potentially pushing towards $120,000.
For more insights on trading strategies and technical analysis, you might find our articles on Bitcoin vs Ethereum and blockchain technology particularly useful.
For those looking to enhance their trading skills, consider using Kai, your TradingView AI companion. Kai provides in-depth technical analysis based on your chart's indicators, helping you become a better trader.
Don't miss out on the advantages offered by the latest in trading technology. Explore more about the differences between fiat and crypto currencies to make informed trading decisions.