BTC/USD Analysis: Symmetrical Triangle Breakout Potential
BTC/USD Analysis: Symmetrical Triangle Breakout Potential - Discover key support and resistance levels, Elliott Wave insights, and Fibonacci targets for Bitcoin's next move.

As we navigate the ever-volatile cryptocurrency market, Bitcoin's current technical setup offers a fascinating opportunity for traders. This article delves deep into the medium-term technical analysis of BTC/USD, focusing on a potentially significant symmetrical triangle breakout. We'll explore key support and resistance levels, Elliott Wave insights, and Fibonacci targets to help you make informed trading decisions.
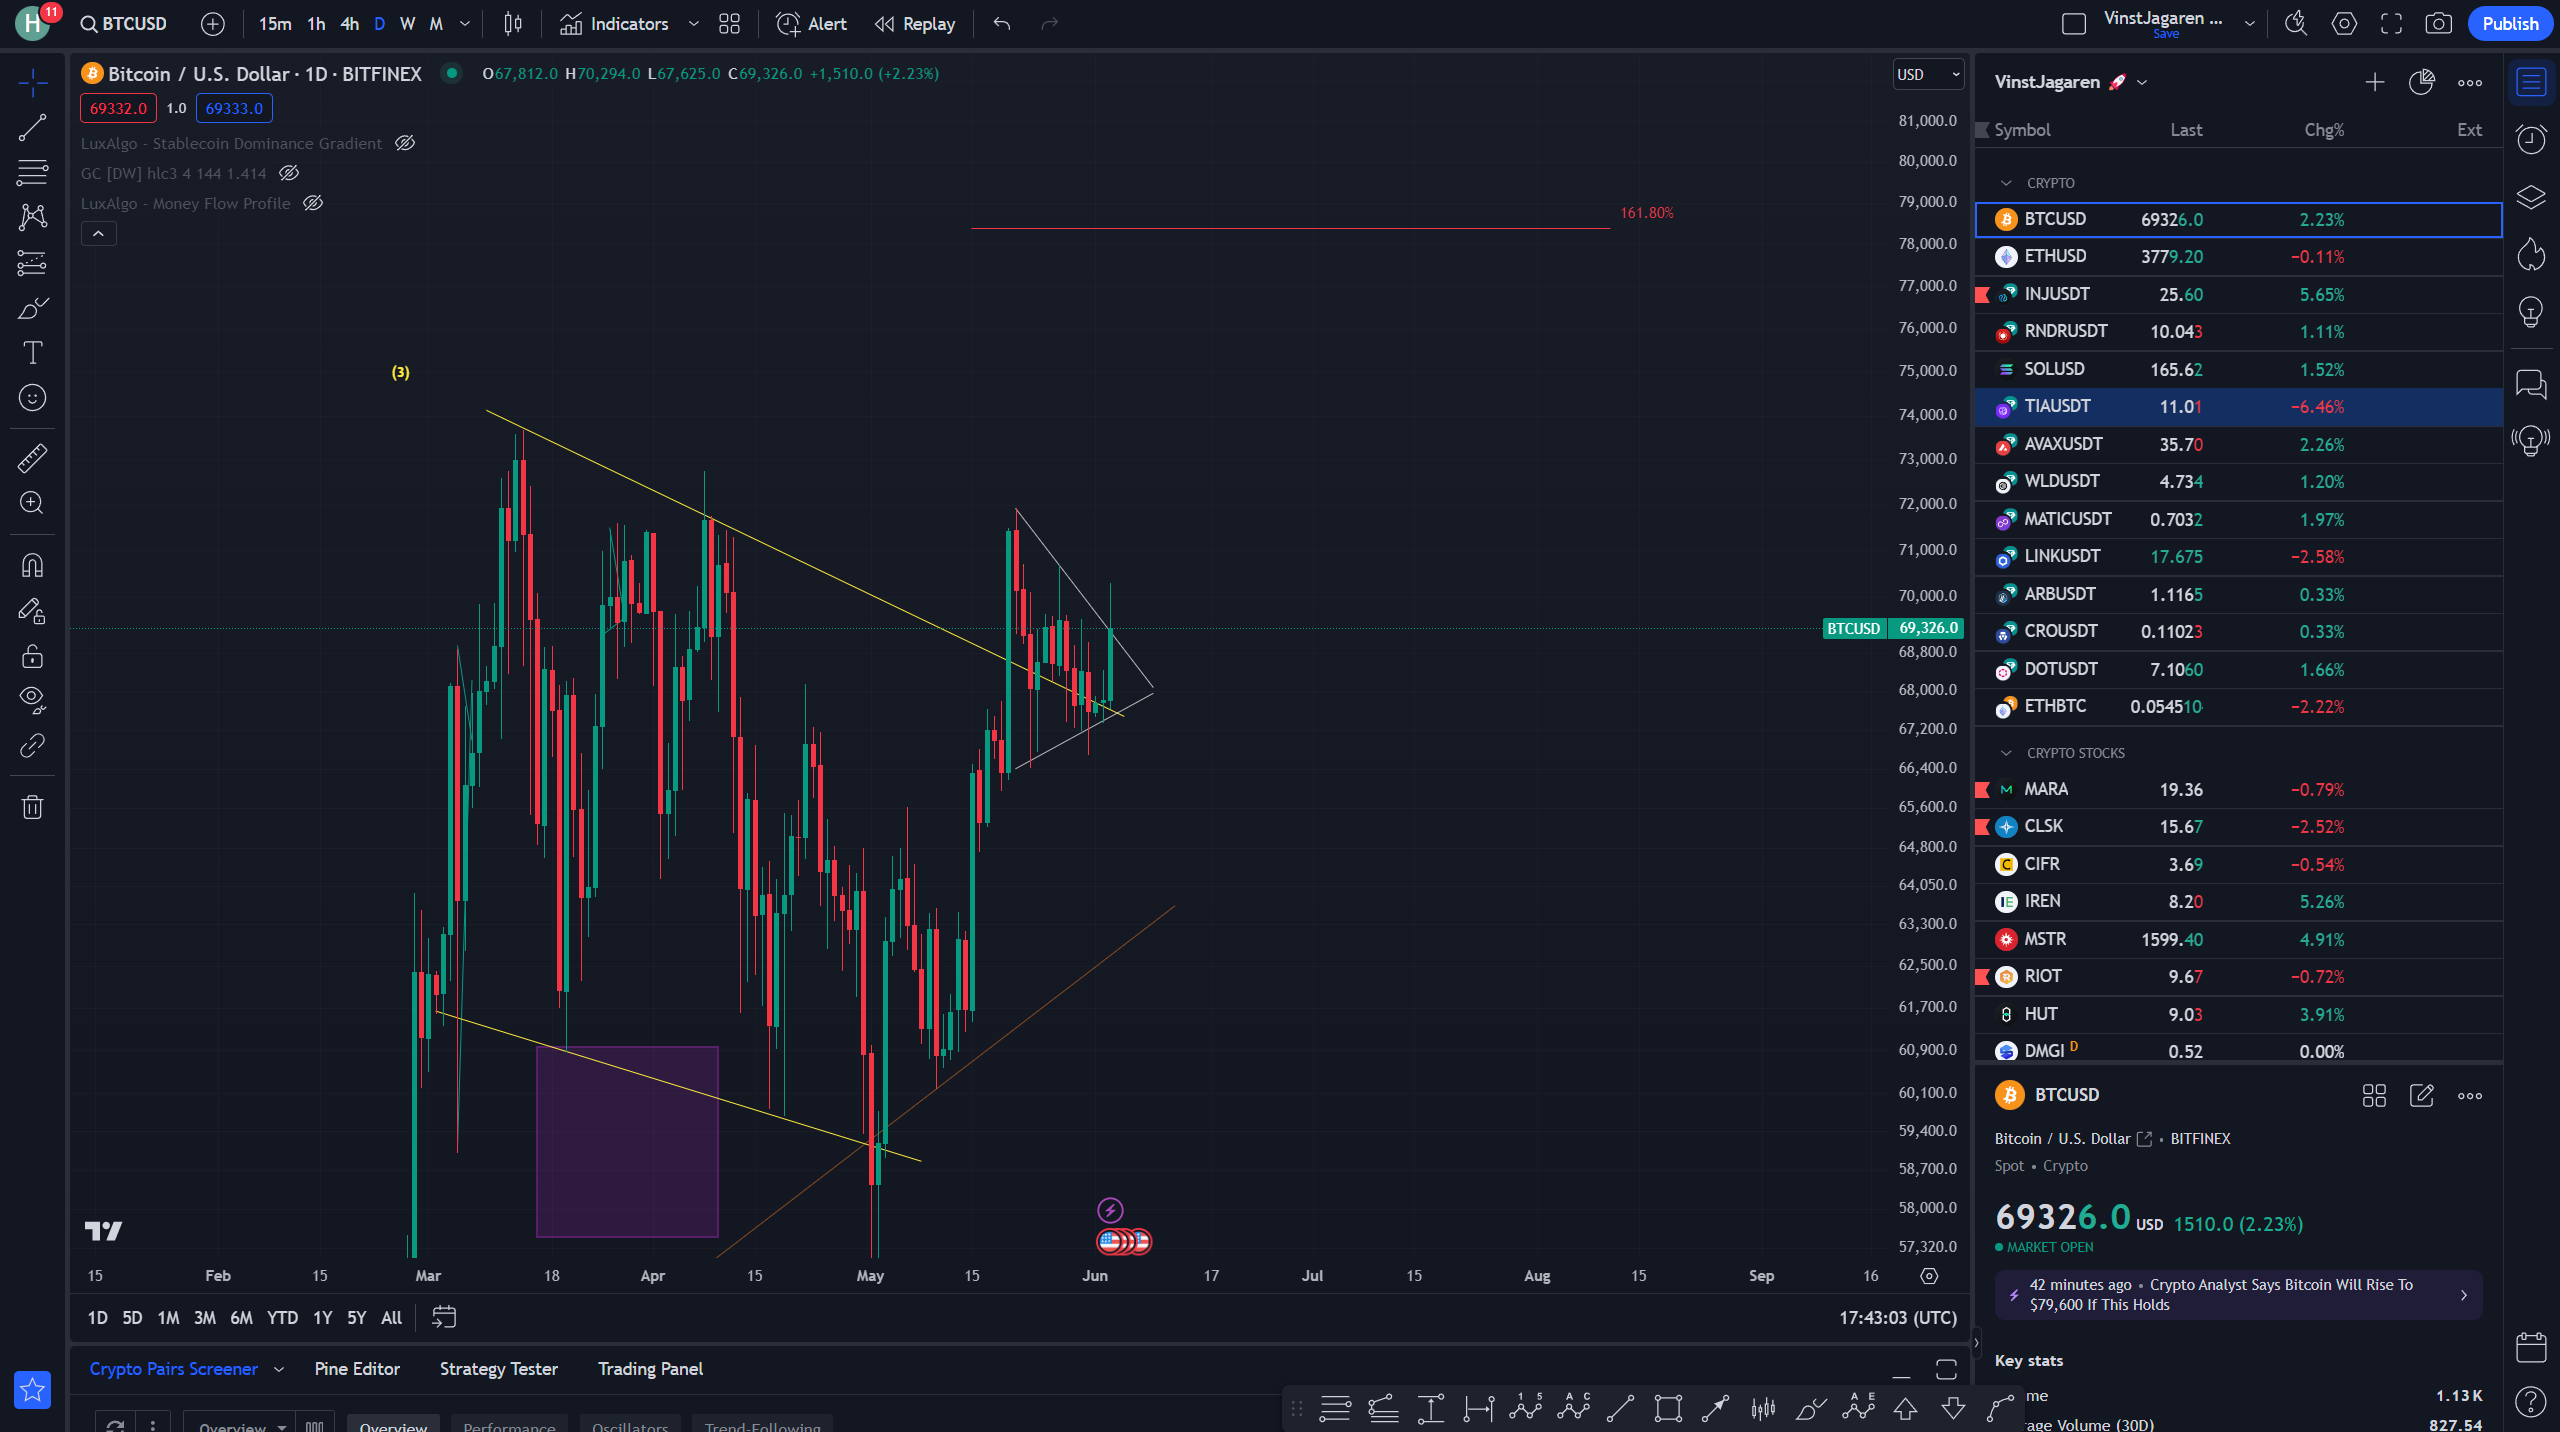
Symbol: BTC/USD (Bitcoin)
Analysis Length: Medium Term
Timeframe: Daily
Trend Analysis
- Current Trend: Neutral with a slight bullish bias
- Direction: Bitcoin's price has recently been consolidating within a symmetrical triangle pattern, typically indicating a potential breakout. Given the recent price action, there's a slight bullish bias suggesting that the breakout may lean towards an upward movement.
Support and Resistance Levels
- Support Levels:
- Near $67,000 (recent low within the triangle)
- Around $64,000 (a stronger support just beneath)
- Resistance Levels:
- Near $71,000 (upper boundary of the triangle)
- Approximately $75,000 (additional resistance noted above the triangle)
Price Movement
The price is maturing within a symmetrical triangle, which usually signals consolidation before a breakout. This consolidation suggests an imminent significant move, potentially providing lucrative trading opportunities.
Elliott Wave Theory
- Current Waves:
- Wave 3: The present structure within the triangle seems to complete a corrective pattern within a possibly larger Elliott wave sequence. This could indicate that a Wave 4 is forming within a larger impulsive wave set, pointing towards a potential Wave 5 breakout.
- ABC Correction may be ending, suggesting an upcoming impulsive wave.
Cycle Analysis
- Weekly/Monthly Lows/Highs:
- The most recent low occurred around $67,000.
- Local highs are around $71,000.
- Upcoming Lows/Highs:
- With the symmetrical triangle's breakout, an imminent high could push towards $75,000 if the resistance is broken.
Algo Zones Based on Fibonacci
- Fib Retracement Levels:
If the price breaks the upper boundary of the triangle (~$71,000), the next target zone would be around the 161.8% Fibonacci extension which hovers around $79,000.
Short/Medium/Long Term Targets
- Short Term (next few days to a week): $71,000
Reason: Previous resistance at the top of the symmetrical triangle.
- Medium Term (weeks to a couple of months): $75,000 to $79,000
Reason: Potential breakout target based on the Fibonacci extension and historical resistance level.
- Long Term (several months): $85,000+
Reason: Following historical bull market trends and if Bitcoin maintains strong support above current levels, it could aim higher post successful breakout.
Conclusion
Overall, Bitcoin (BTC/USD) exhibits a potential near-term bullish breakout from a symmetrical triangle pattern. A breakout above $71,000 could target around $75,000, with a medium-term target up to $79,000 based on Fibonacci extensions. Key considerations include confirming the breakout and monitoring support zones around $67,000 to manage potential downside risks. If the breakout fails, a retest of lower supports around $64,000 might be observed. The Elliott Wave formation suggests we might be nearing the end of a corrective pattern with an impulsive move on the horizon.
Trade cautiously and watch for a confirmed breakout or breakdown from the current consolidation pattern. To deepen your understanding, consider exploring what is technical analysis and Bitcoin vs. Ethereum for a broader market perspective.
For those leveraging TradingView, our AI assistant, Kai, can significantly enhance your trading strategy. Kai provides in-depth analysis based on various technical methods, such as Trend analysis, Support and Resistance levels, Price movement, Elliott wave theory, Cycle analysis, Algo zones, and Target analysis. Discover more about what is day trading and what is swing trading to refine your trading approach.
Ready to revolutionize your trading experience? Download Kai today and start receiving personalized, AI-powered insights directly on your TradingView charts. For more information, visit our guide on what is blockchain and how it impacts the cryptocurrency market.
Trade smart, stay informed, and leverage the power of AI with TradingWizard.