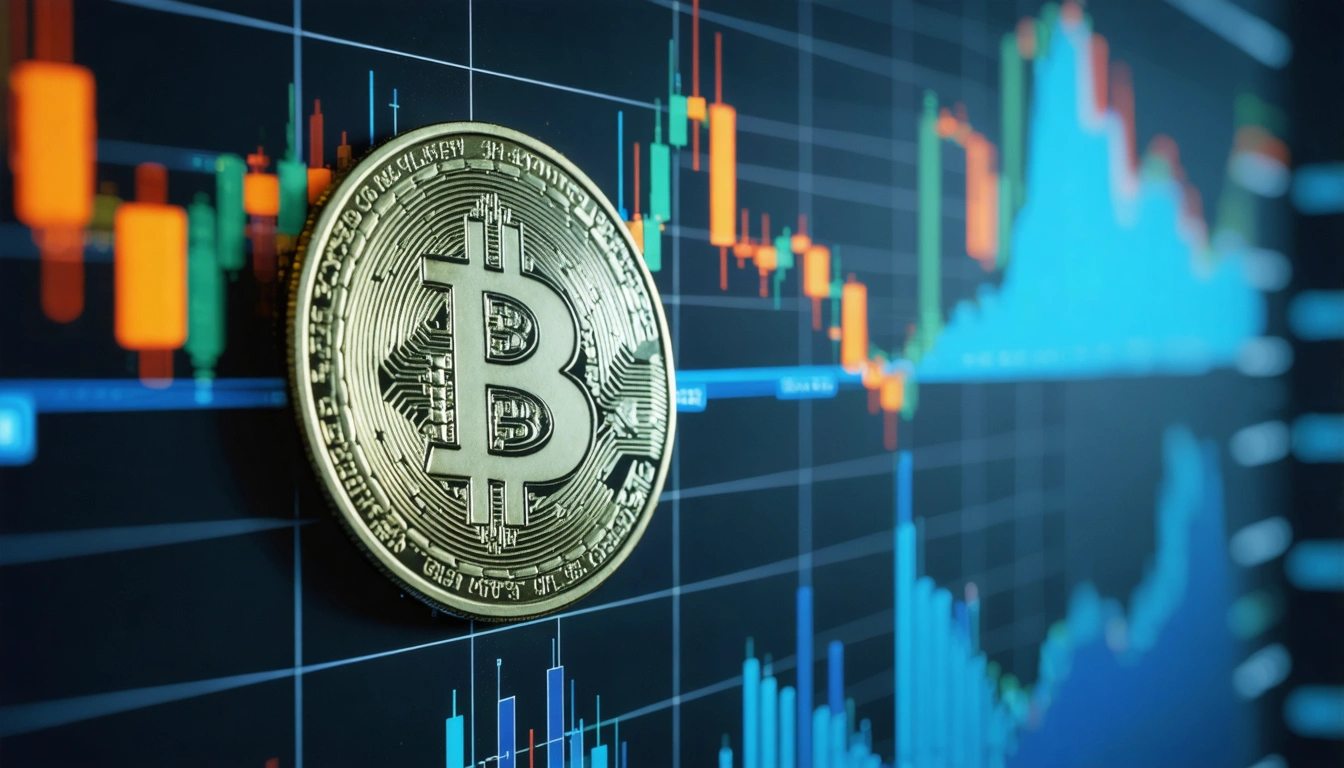

Market Context
The digital asset landscape shifted aggressively in early February 2026. As of February 12, 2026, Bitcoin (BTC) is consolidating just below $125,000 following a massive 14% weekly rally. This move isn't retail-driven FOMO; it is a structural supply-side crisis. According to recent filings from the U.S. Securities and Exchange Commission, institutional participation via Spot ETFs has reached a new saturation point, with BlackRock’s IBIT alone crossing $60 billion in AUM.
- Supply Squeeze: Daily exchange outflows reached a 3-year high on February 9, 2026, as "HODL" behavior locks up circulating supply.
- Macro Tailwinds: A softening DXY (Dollar Index) and stabilizing 10-year Treasury yields have pushed capital back into "risk-on" apex assets.
- Corporate Adoption: Following the lead of MicroStrategy, three more S&P 500 firms announced Bitcoin treasury allocations this quarter.
Data Highlights
The divergence between "Paper Bitcoin" (futures/options) and "Physical Bitcoin" (spot) is widening. Open interest on the CME Group crypto desk suggests a heavy bias toward long-call spreads at the $140,000 strike for March 2026 expiry.
| Metric | Value/Change (Feb 2026) |
|---|---|
| BTC Spot Price | $124,850 (+4.2% 24h) |
| ETF Net Inflow (Weekly) | $3.2 Billion |
| Exchange Reserve Level | Multi-year Low (1.8M BTC) |
| Funding Rates (Perps) | 0.015% (Neutral-Bullish) |
Trade Takeaways
The trend is undeniably bullish, but the "air is getting thin" near $125k. I am watching for a liquidity sweep of the $118,000 - $120,000 support cluster before the next leg to $140k. If the daily candle closes below $115,000, the bullish thesis pauses as the market flushes over-leveraged longs.
The Strategy: Look for "dip-buying" opportunities using VWAP (Volume Weighted Average Price) anchored to the February 1st breakout. Avoid chasing the green candles at the $125k resistance wall.
And if you want to act fast: use Chart Analyzer to spot hidden divergence, scan opportunities in the app, and automate your exit strategy via Algo AI Trading Bots. Check pricing or learn more at our academy.
FAQ
Is $125,000 a local top for Bitcoin?
Technically, $125k represents a major psychological level and a 1.618 Fibonacci extension. While a pullback is healthy, the lack of exchange supply suggests any dip will be aggressively bought by ETF issuers. See CoinDesk for real-time order book depth.
How should I manage risk at these all-time highs?
Reduce position sizing and use trailing stops. Volatility at $120k+ means a 5% move is $6,000—enough to liquidate tight stops. Focus on the 4-hour trend structure.
Which tools help track these institutional flows?
Use Chart Analyzer for instant structure, then set alerts for whale movements with Algo AI Trading Bots.
Sources
Ready to act? Head to TradingWizard.ai, analyse the BTC chart in seconds and turn these institutional signals into a structured trading plan.