Bitcoin Bull Flag & MACD Signal New BTC All-Time High Imminent
Discover why Bitcoin's Bull Flag pattern and MACD indicator suggest a new all-time high is imminent. Expert analysis and insights revealed.
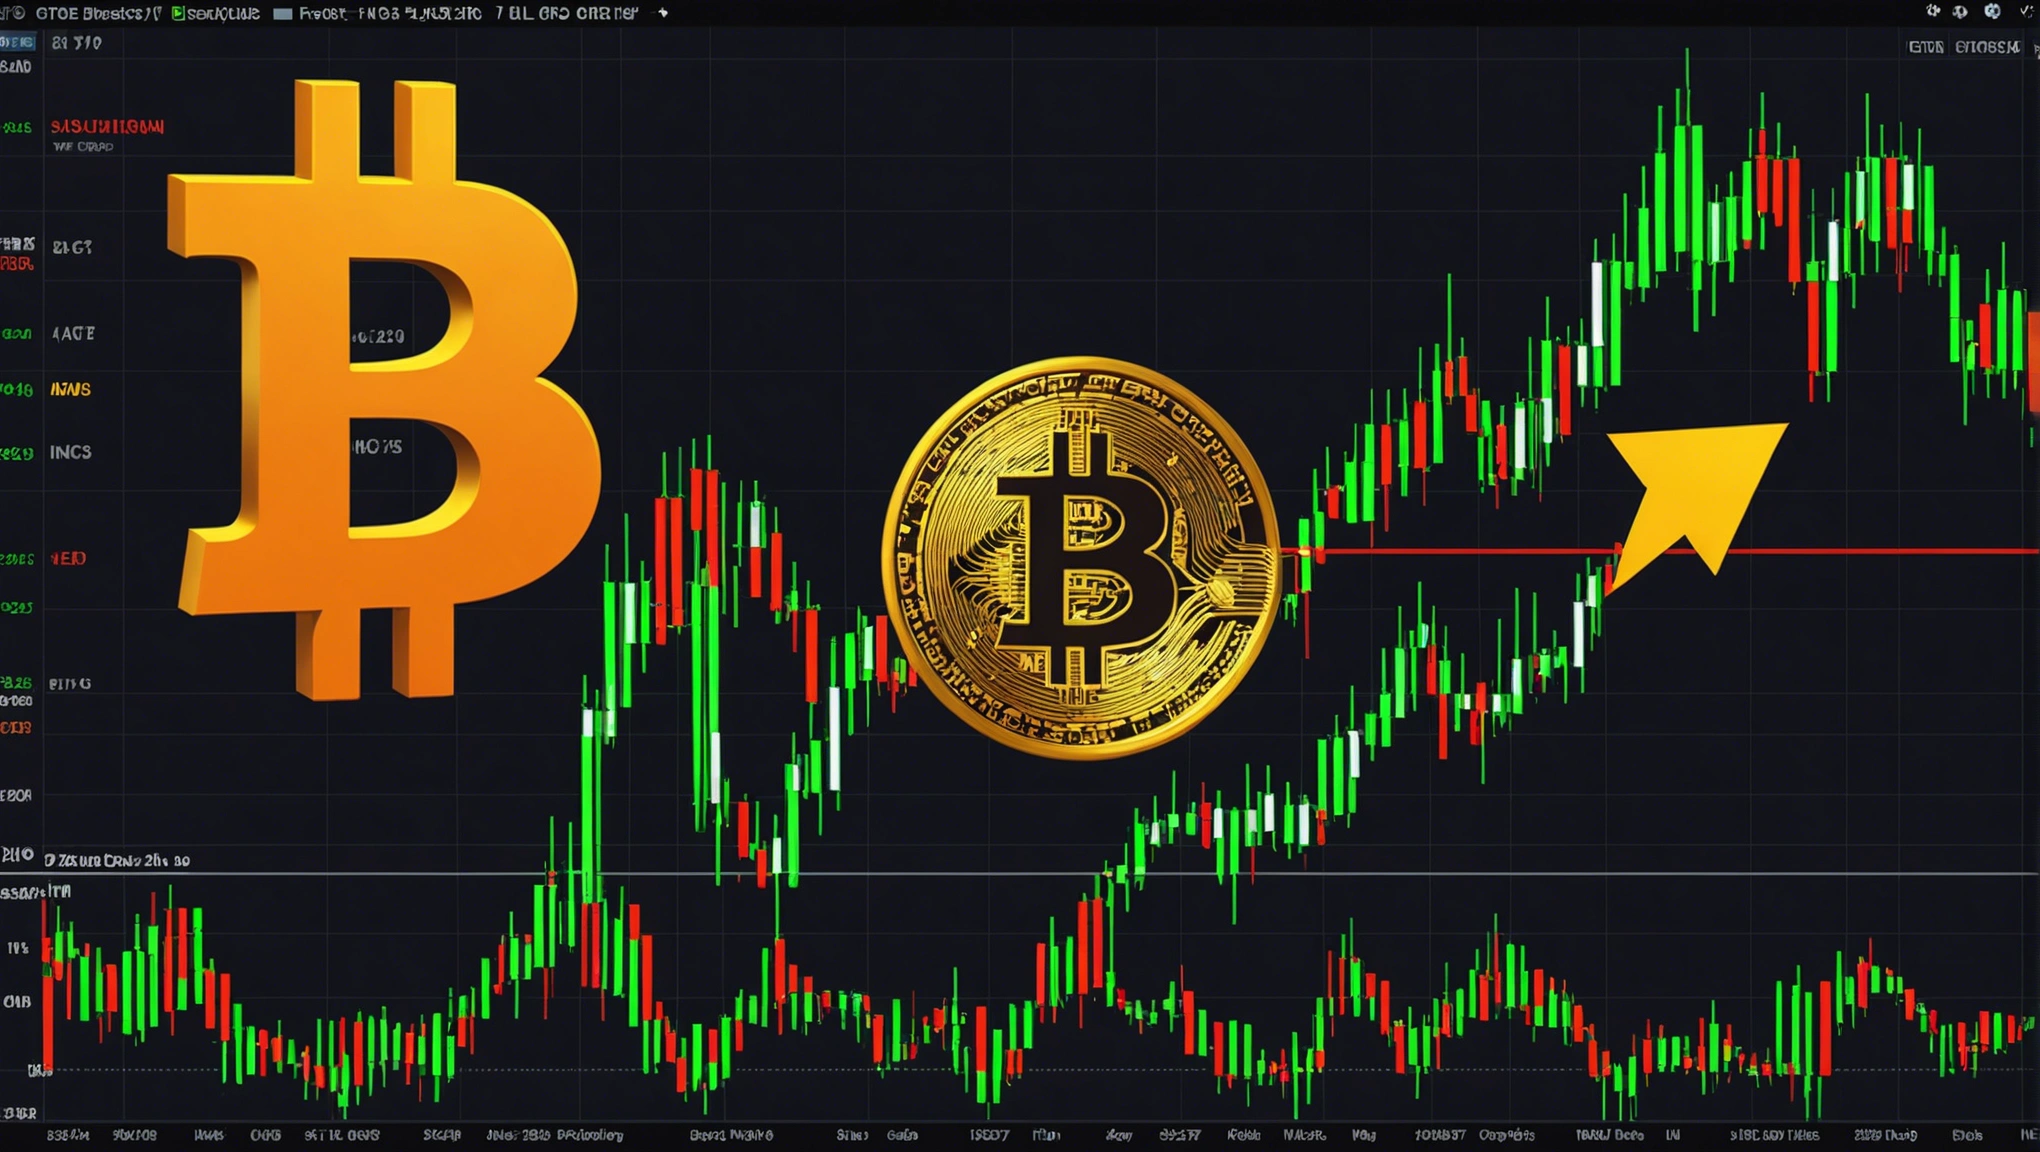
Bitcoin traders remain bullish over a BTC price breakout despite months of consolidation — and on-chain data supports them. The continued optimism in the market is underlined by the presence of a Bull Flag pattern and the Moving Average Convergence Divergence (MACD) indicator, both of which signal a potential new all-time high for Bitcoin.
Bitcoin's Bull Flag: A Classic Bullish Continuation Pattern
The Bull Flag pattern is a technical analysis tool used by traders to predict future price movements. It appears when a cryptocurrency experiences a steep rise in price, followed by a period of consolidation. This pattern typically signals that the asset is likely to break out in the direction of the preceding trend, which in Bitcoin's case, indicates a move higher.
In a recent post on X (formerly Twitter), popular trader and commentator Alan Tardigrade highlighted the current Bitcoin price action, comparing it to mid-February. Back then, Bitcoin needed less than a month to hit new all-time highs when a classic on-chain indicator flashed green. Now, the same setup is executing, with clear implications for BTC price strength.
MACD: The Bullish Cross
The MACD is another powerful tool in the trader's arsenal, measuring trend strength and identifying potential buy and sell signals. On the three-day timeframes, the MACD is busy building positive bars after a "red" period that began in early April. This bullish cross, where the MACD line crosses above the signal line, often precedes a significant upward price movement.
“Coincidence or Price action??” Tardigrade queried while presenting the phenomenon. “Bull Flag and MACD Bullish Cross at the same time. After a breakout to the Bull Flag, $BTC will surge higher.”
As BTC/USD consolidates within a Bull Flag, the last time it exited to the upside along with a green MACD, new all-time highs required only a matter of weeks. This pattern has long been on the radar for market observers tracking the current Bitcoin bull market.
Historical Context and Market Sentiment
In late December, data from Cointelegraph Markets Pro and TradingView confirmed that a trip back into "red" territory on the three-day MACD preceded the turbulence around the debut of the United States' spot Bitcoin exchange-traded funds (ETFs). Despite the current sideways BTC price landscape, traders remain optimistic about a breakout.
For more insights into technical analysis and how to apply these methods to your trading strategy, check out our detailed guide on What is Technical Analysis.
Bitcoin Price Predictions: Sky-High Targets
The current consolidation below the March highs has lasted nearly three months, and some analysts warn that Bitcoin might continue to stay rangebound for weeks or more. However, this has not stopped sky-high BTC price predictions from making a return. Research firm Fundstrat Global Advisors has set a $150,000 target for 2024, while traders eyeing June have set a more immediate target of $85,000 or more.
Learn more about the differences between Bitcoin and Ethereum in our comprehensive article on Bitcoin vs Ethereum.
The Role of On-Chain Metrics and Market Sentiment
On-chain metrics are crucial for understanding market sentiment and predicting future price movements. The current data suggests that the most "parabolic" stage of the bull run has not yet entered, implying that significant upward movement is still possible. For those interested in diving deeper into blockchain technology, our article on What is Blockchain offers detailed insights.
Trading Strategies and Tools
For amateur and medium traders looking to capitalize on these potential price movements, understanding various trading strategies is essential. Day trading and swing trading are two popular methods that can be employed. Our guides on What is Day Trading and What is Swing Trading provide valuable information to help you get started.
To make your trading even more efficient, consider using TradingWizard's Kai, your personal TradingView AI companion. Powered by OpenAI's GPT-4, Kai helps you become a better trader, gain valuable insights from your TradingView chart, and speed up your trading analysis. It's free to download and use, with user privacy as a top priority.
- Click the "Add to Chrome" button and pin it to your toolbar.
- Log into your account.
- Go to TradingView and load your chart.
- Ask Kai and receive an in-depth analysis.
Discover more about how Kai can assist you in our Chrome Webstore page.
Conclusion
The combination of the Bull Flag pattern and the MACD bullish cross suggests that Bitcoin may be on the verge of another significant price surge, potentially reaching new all-time highs. While the market remains in a state of consolidation, the underlying technical indicators and on-chain metrics provide a strong case for bullish momentum. Stay informed and prepared by utilizing advanced trading tools and strategies to capitalize on these potential market movements.
For more information on the differences between fiat and cryptocurrency, check out our article on Fiat vs Crypto Currency.
Stay tuned to TradingWizard for the latest market analysis and insights, and make sure to leverage the power of Kai to enhance your trading experience.